
Monitor BSOD trends from Intune restart reports (archive)
Historical workflow for blue-screen trends from Intune restart reports. Review the retired Azure Anomaly Detector dependency before reusing the code.
Historical blue-screen monitoring example: Azure Anomaly Detector retired on 1 October 2026. This integration is preserved as a reference, not a new deployment recommendation. Review remaining workloads against the Microsoft retirement notice.
Welcome to the third part of my series in which I describe ways to get proactive notifications when something in your environment has a problem / error. So that this monitoring does not work with static values, I use Azure Cognitive Services (now Azure AI Services) to detect anomalies via machine learning. In this blog we will take a look at the Endpoint Analytics Startup performance bluescreen detection. The goal is to detect anomalies automatically, so we are notified when an unusual number of devices report a blue screen or problem during detection. You can read more about anomaly detection on Microsoft Learn.
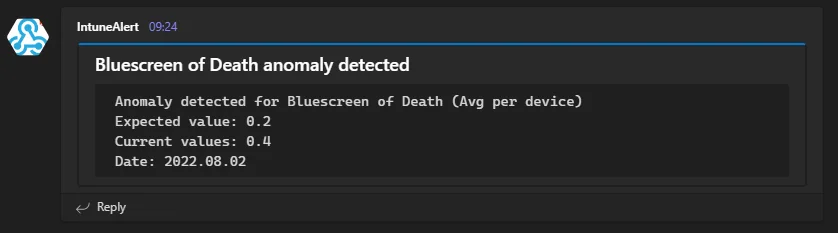
How did we get the data to detect anomalies
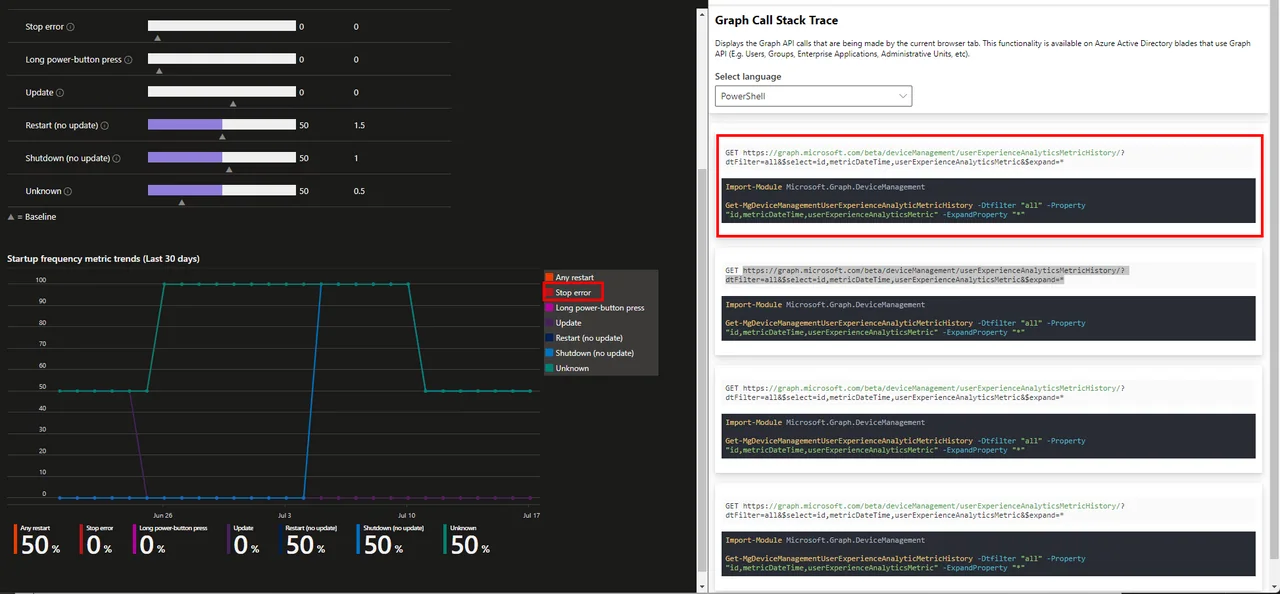
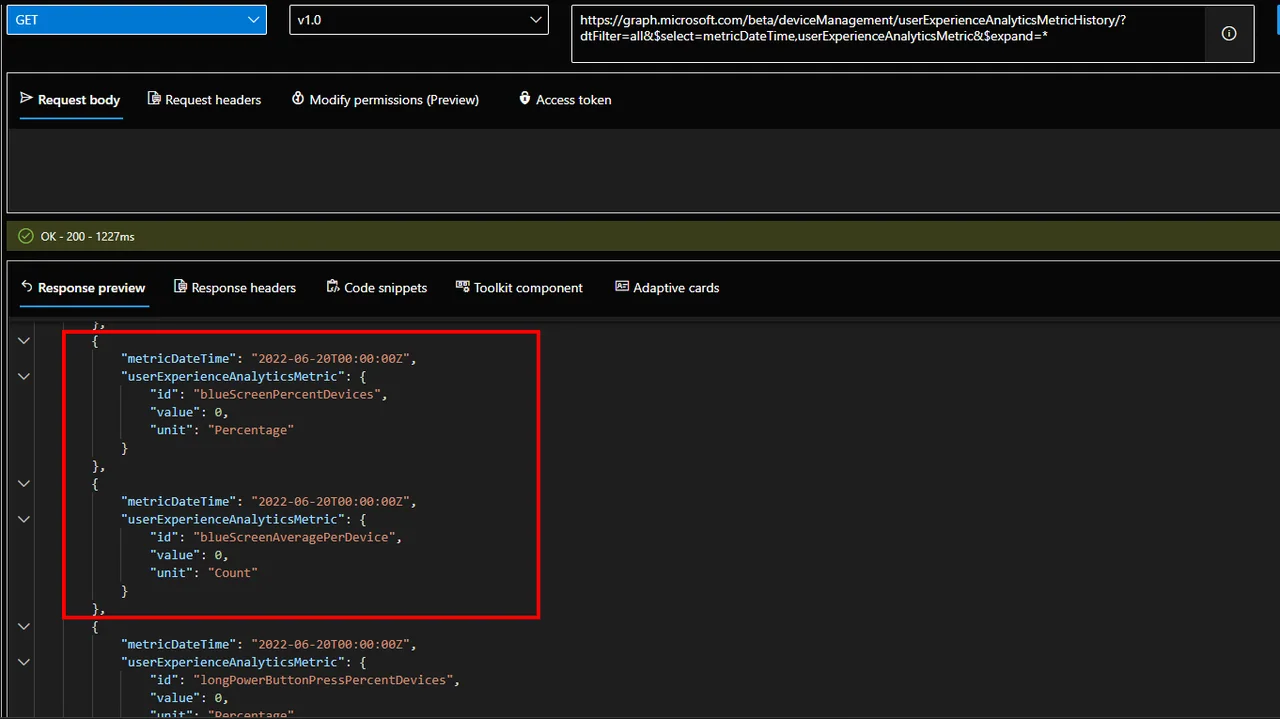
On the Startup performance > Restart frequency page we get all the information we need. I used the Graph X-Ray tool to find out which graph endpoint gives me this information. Btw. this tool is highly recommended; it makes searching for graph calls very easy. So now let’s take a closer look at the call in graph explorer and adjust it so we can later detect anomalies in this BSOD history.
Looks like exactly what we need. We have a history here and get the information of the average blue screen of death per device, as well as the percentage of BSODs among the restart reasons.
Then let’s see how we can build proactive anomaly detection to detect anomalies using Azure Automation, Azure AI Services and PowerShell. If you missed it, you can also check out my other posts on jannikreinhard.com covering the rest of this series.
Deployment of the Azure AI Services anomaly detector
- Open the Azure Portal and Search for Anomaly detectors
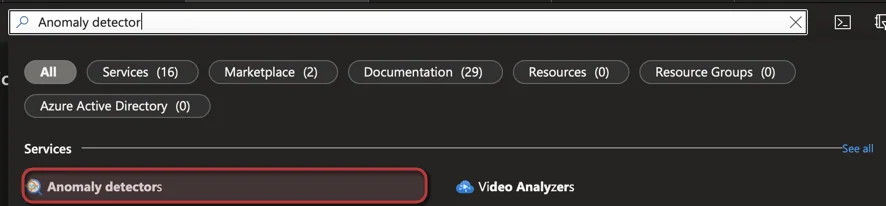
- Click + Create
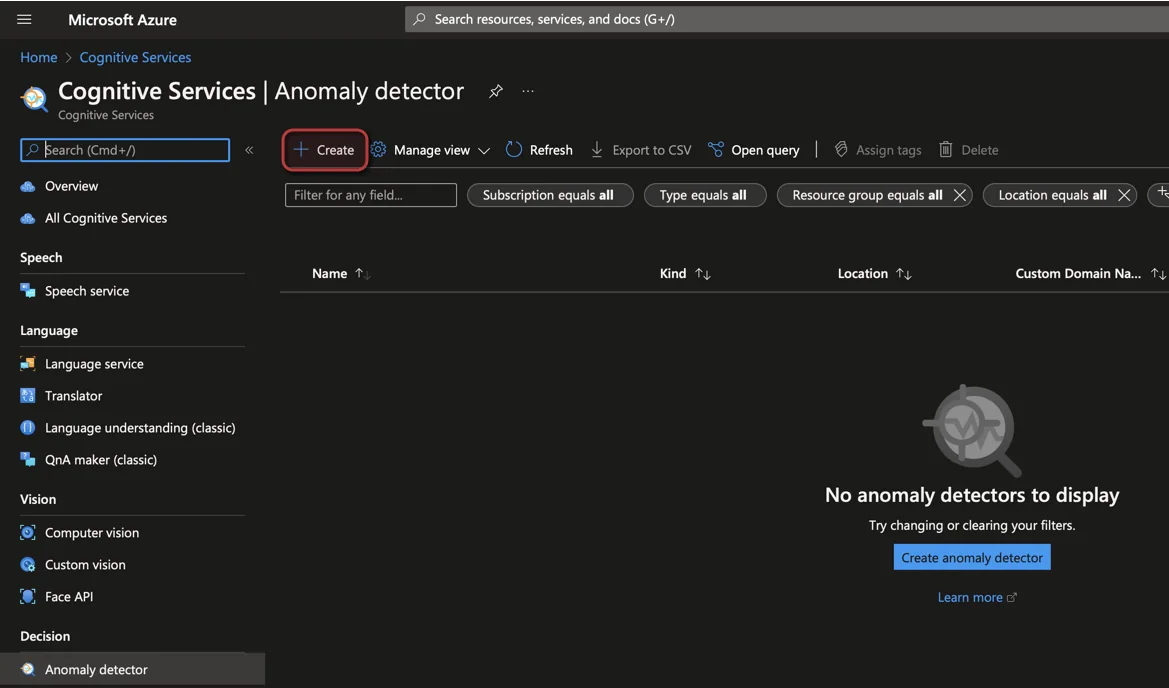
- Select a Subscription and Resource group
- Select a Region and enter the Name of the Anomaly Detector
- Select the price tier (For testing Free F0 is sufficient)
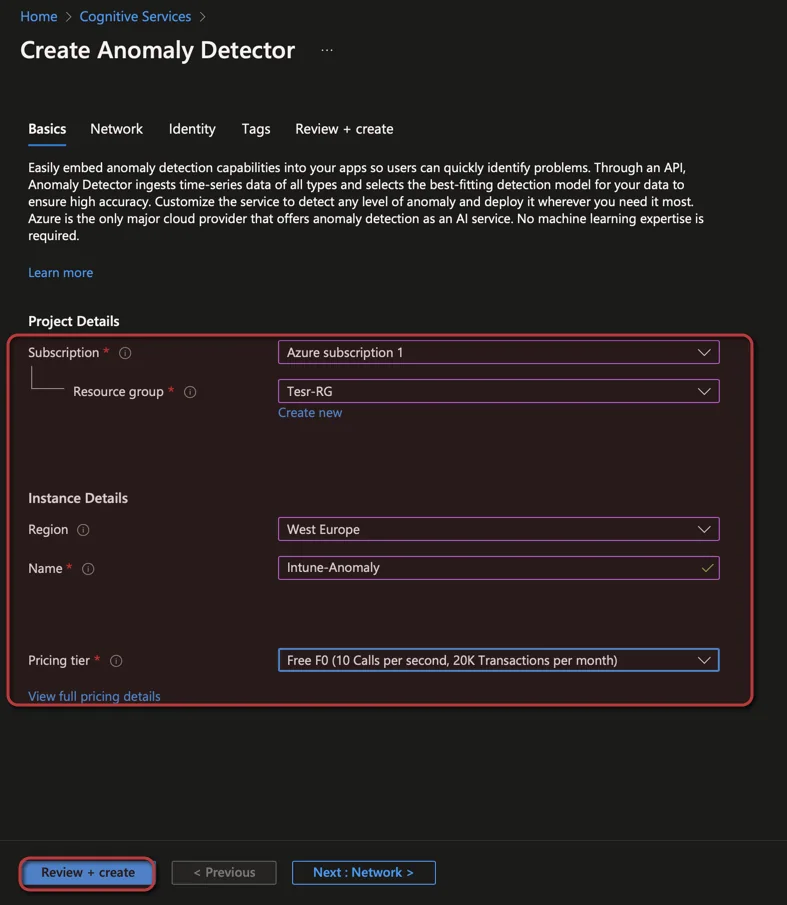
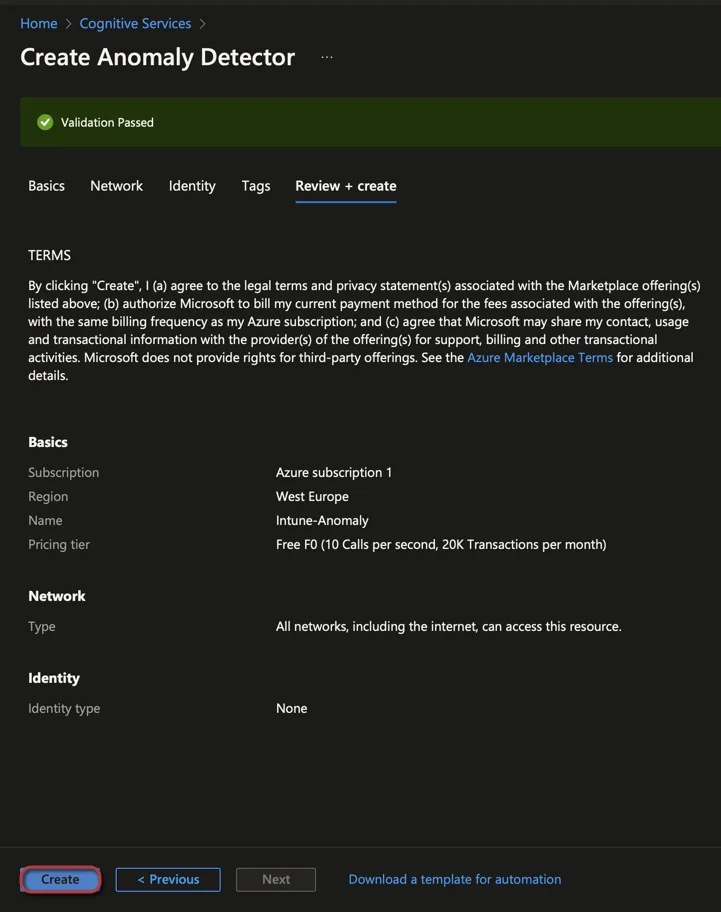
- Click Create
Get Teams WebHook URL
-
Create an MS Teams channel and add the webhook connector
-
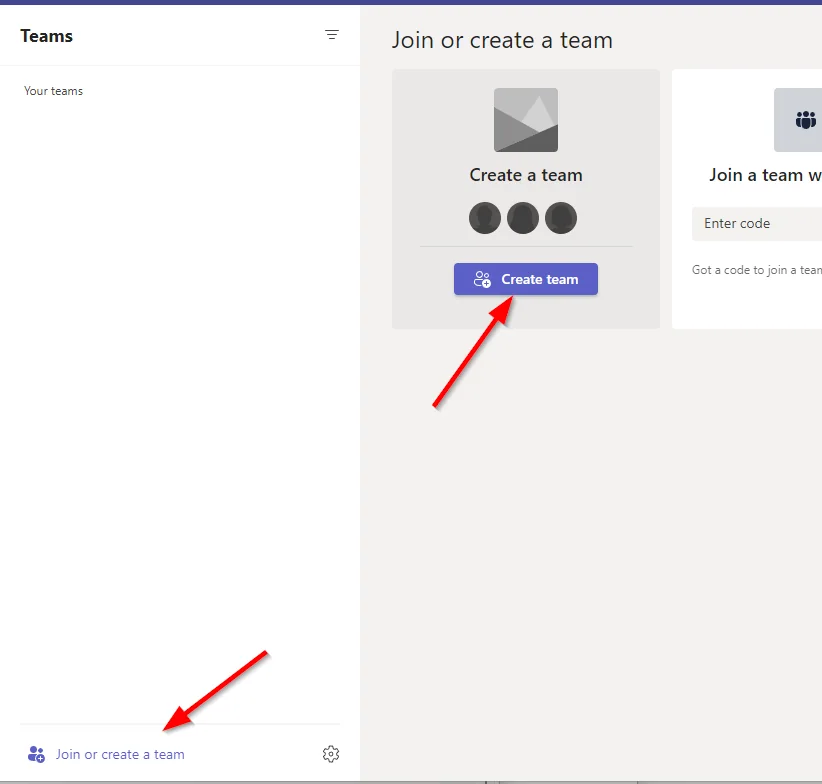
-
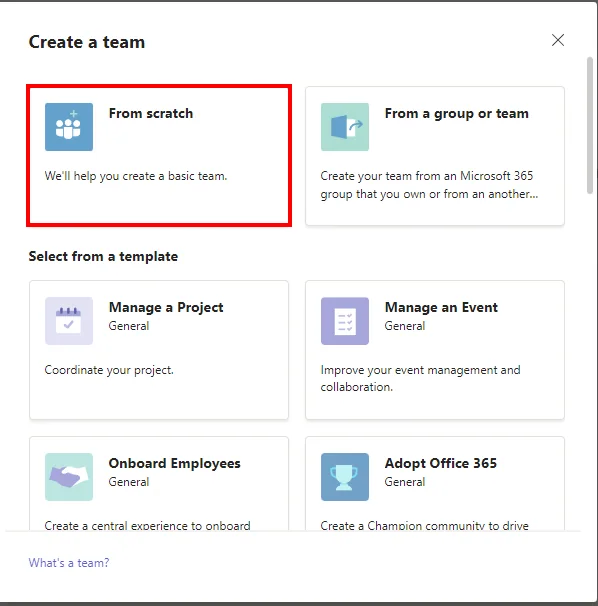
-
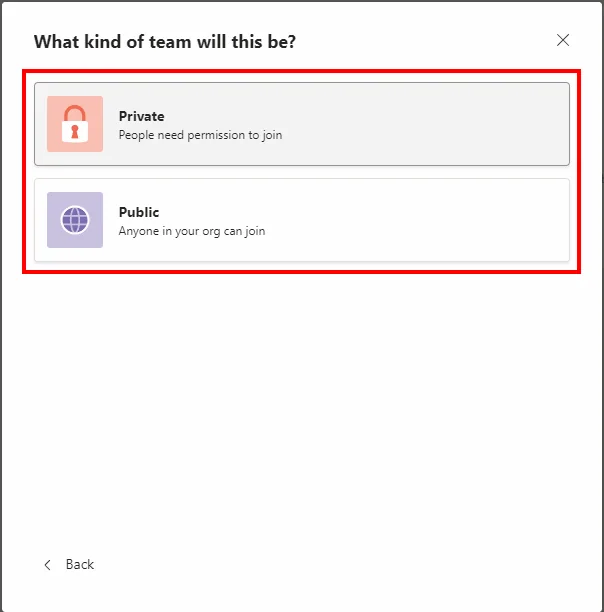
-
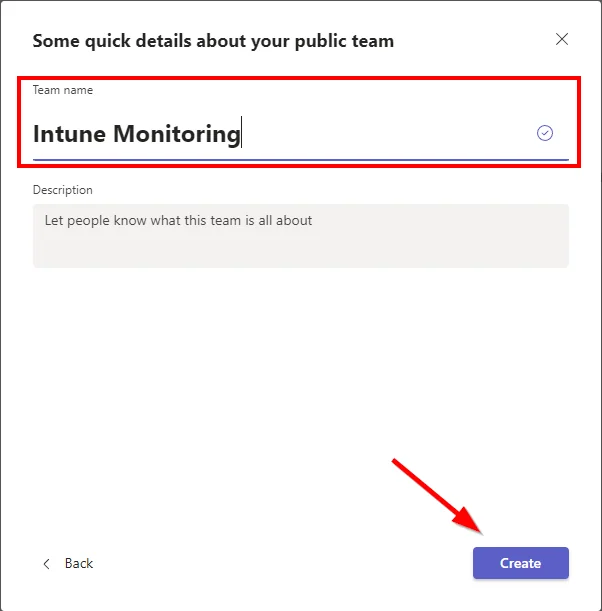
-
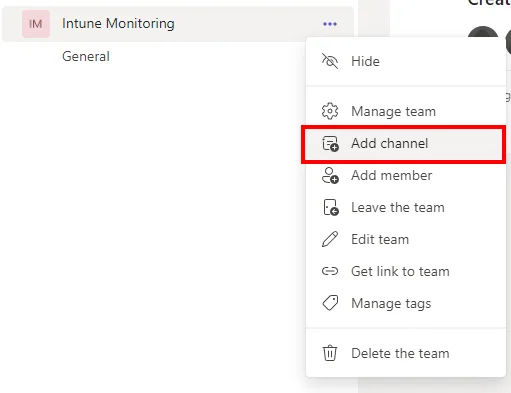
-
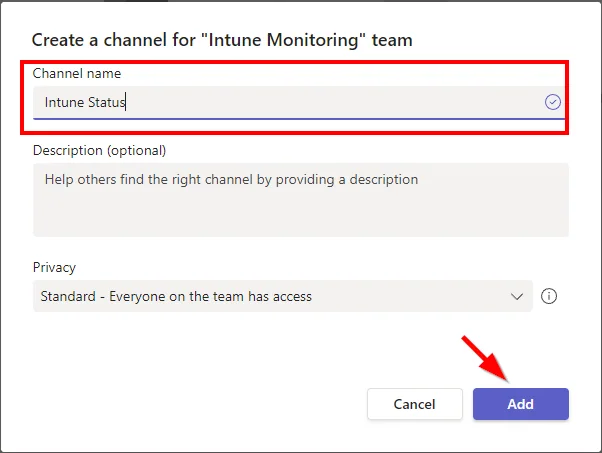
-
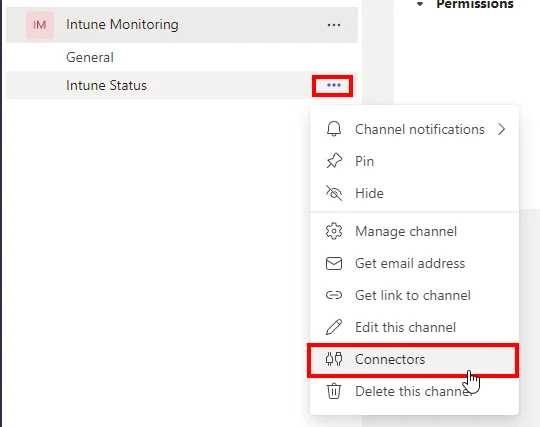
-
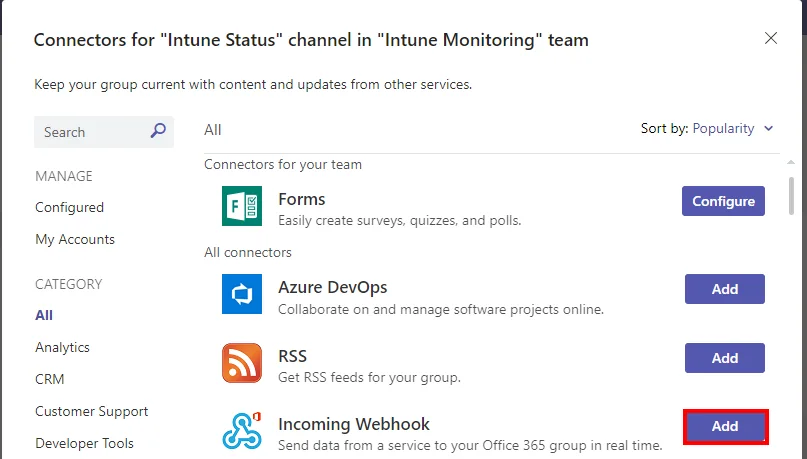
-
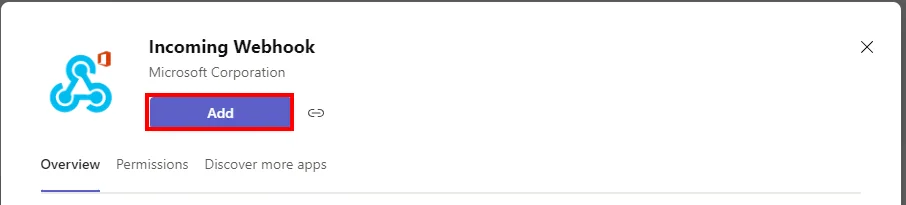
-
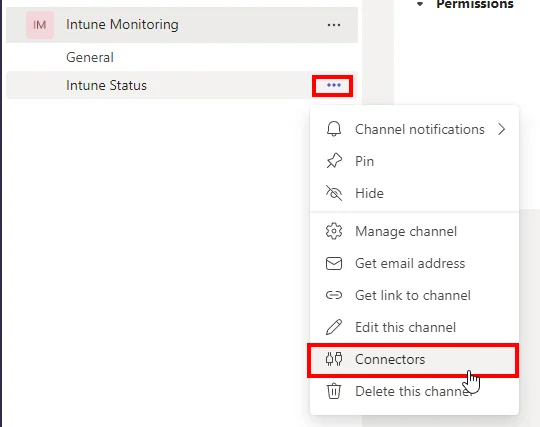
-
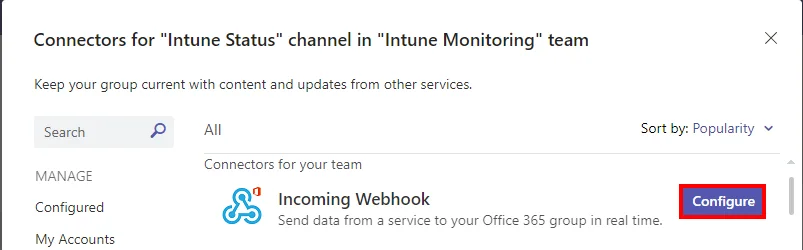
-
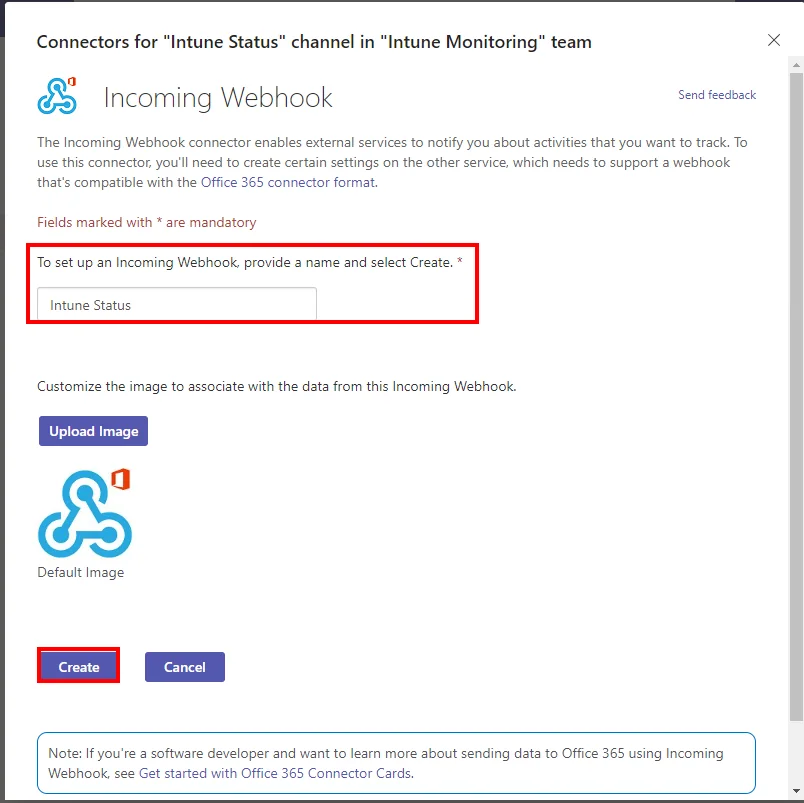
-
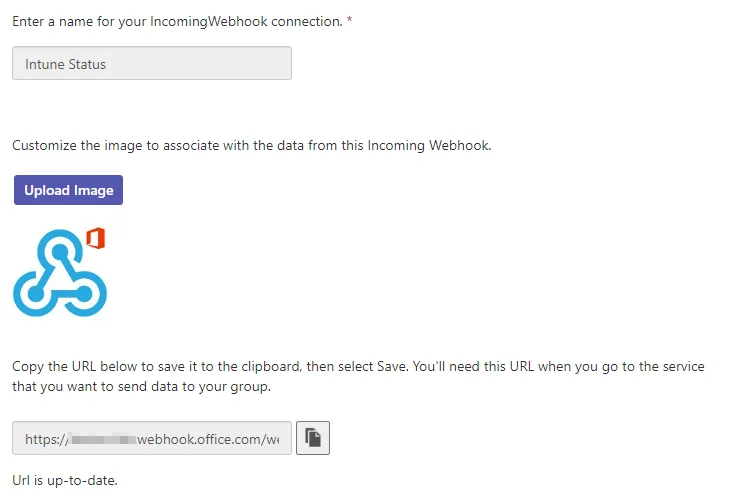
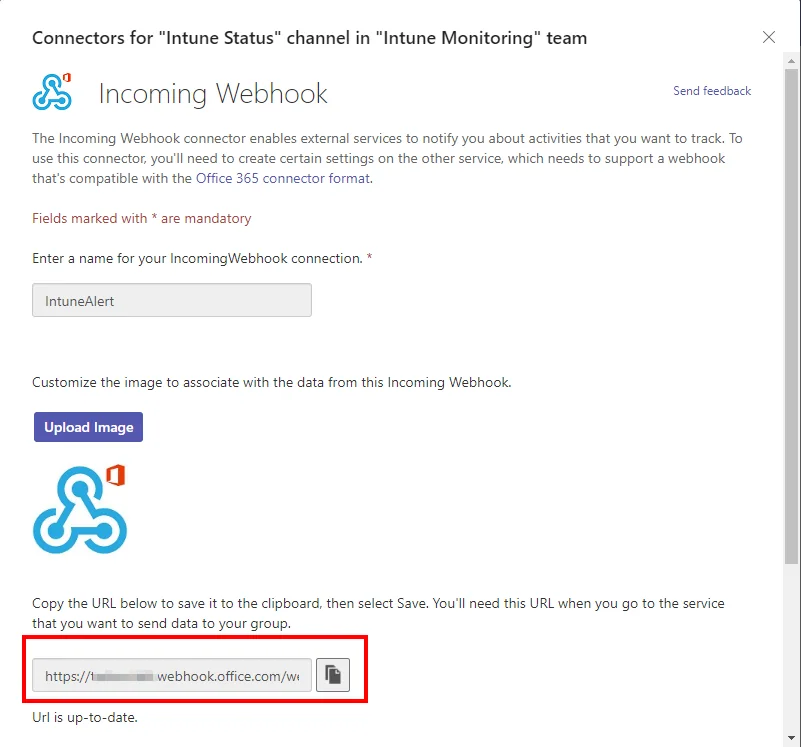
Copy the WebHook URL
Create an App Registration
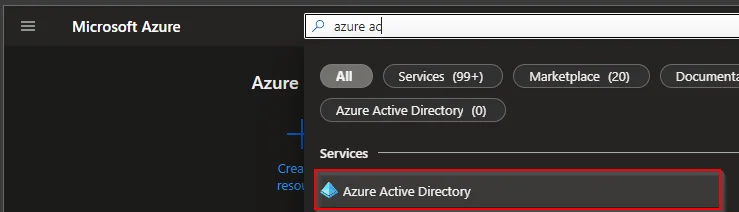
- Search for Microsoft Entra ID
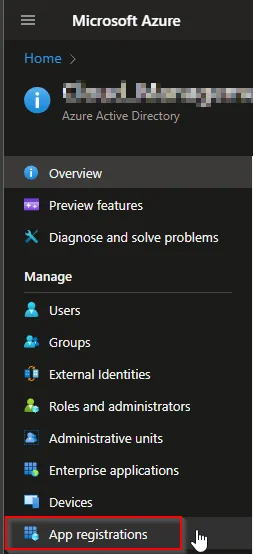
- Select App registration
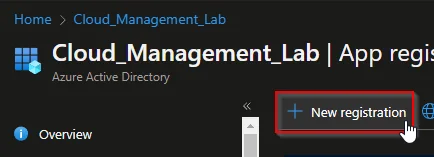
- Select +New registration
- Enter a Name and click Register
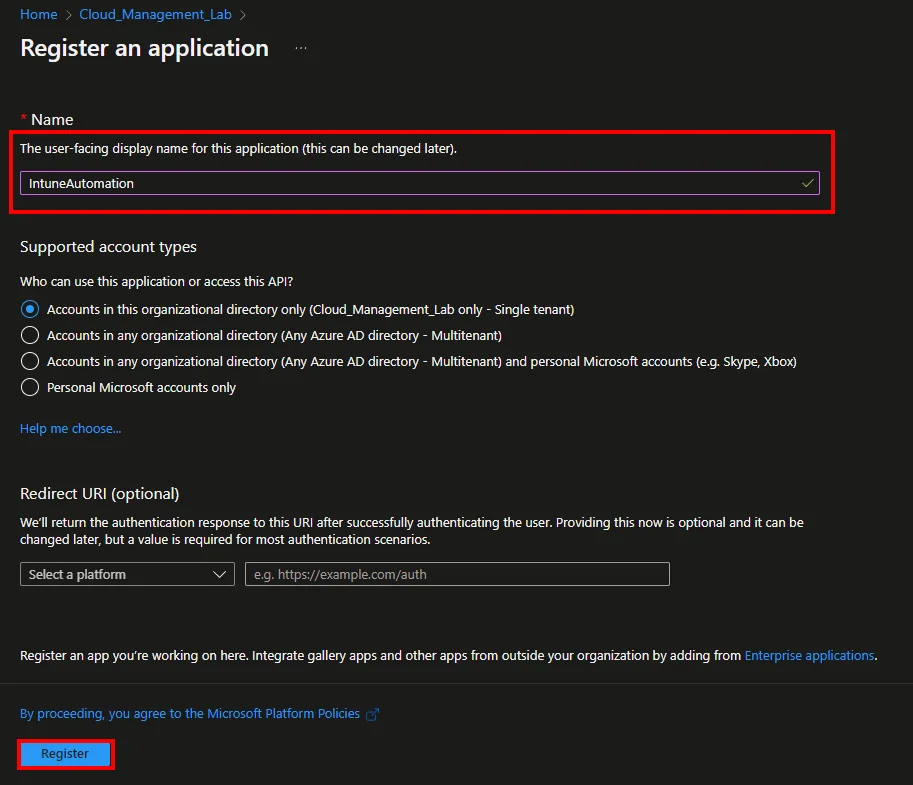
- Click API permissions and +Add a permission
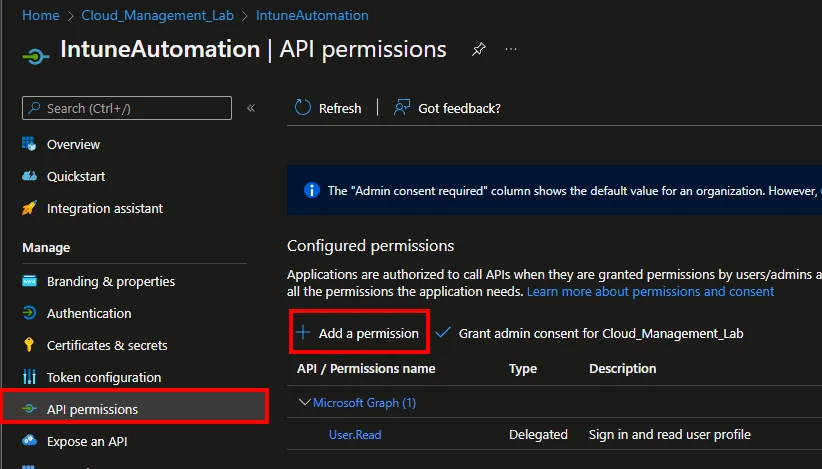
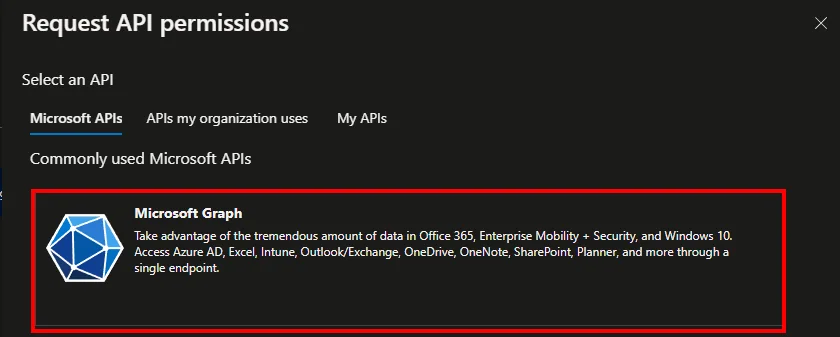
- Select Microsoft Graph
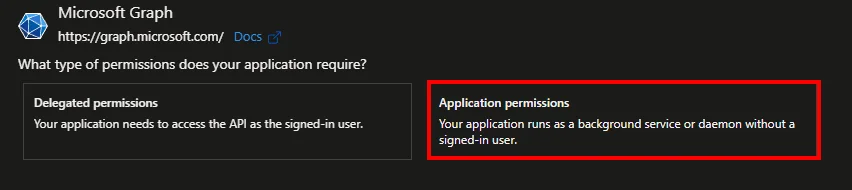
- Select Application permissions
- Search for DeviceManagementManagedDevices.Read.All
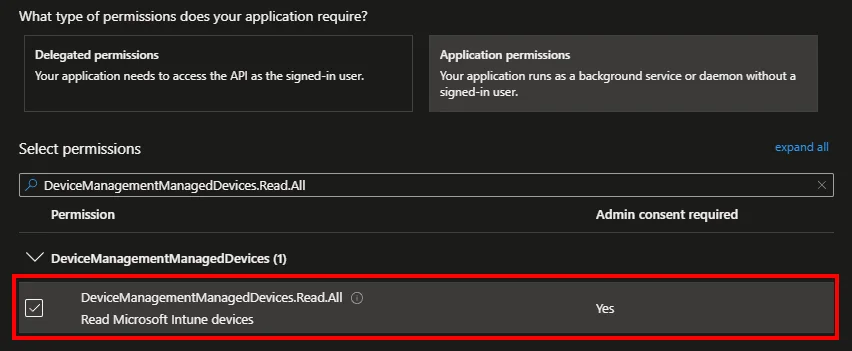
- Click Grant admin consent for *** and approve with Yes

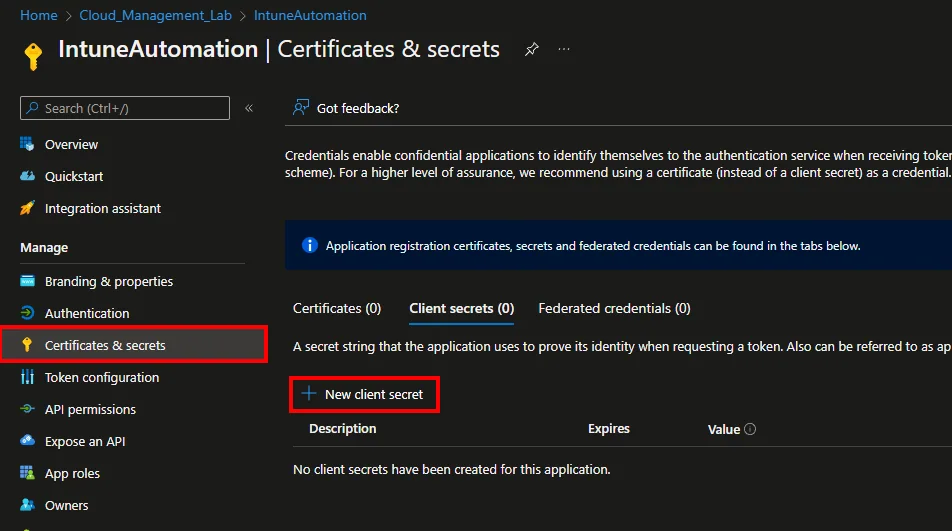
- Select Certificates & secrets and click +New client secret
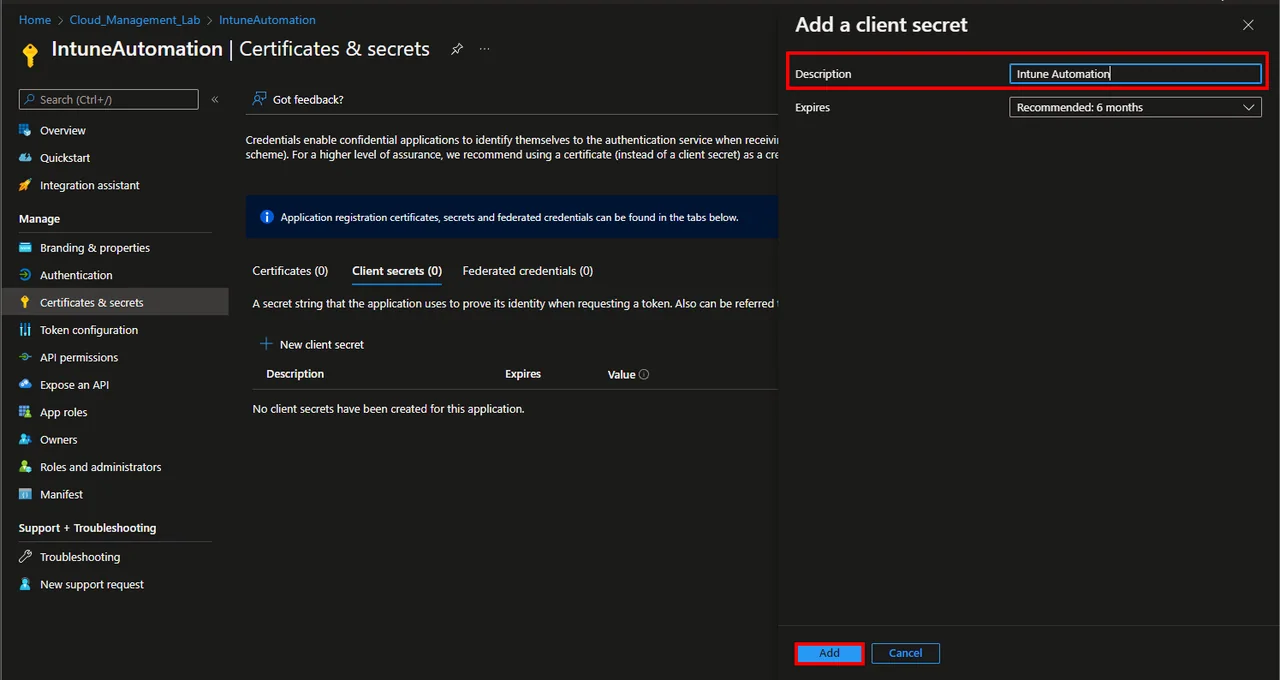
- Enter a Description and select an Expires time
- Click Add
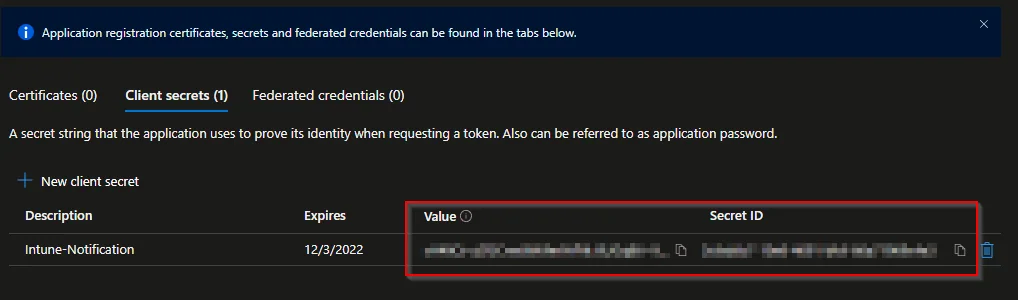
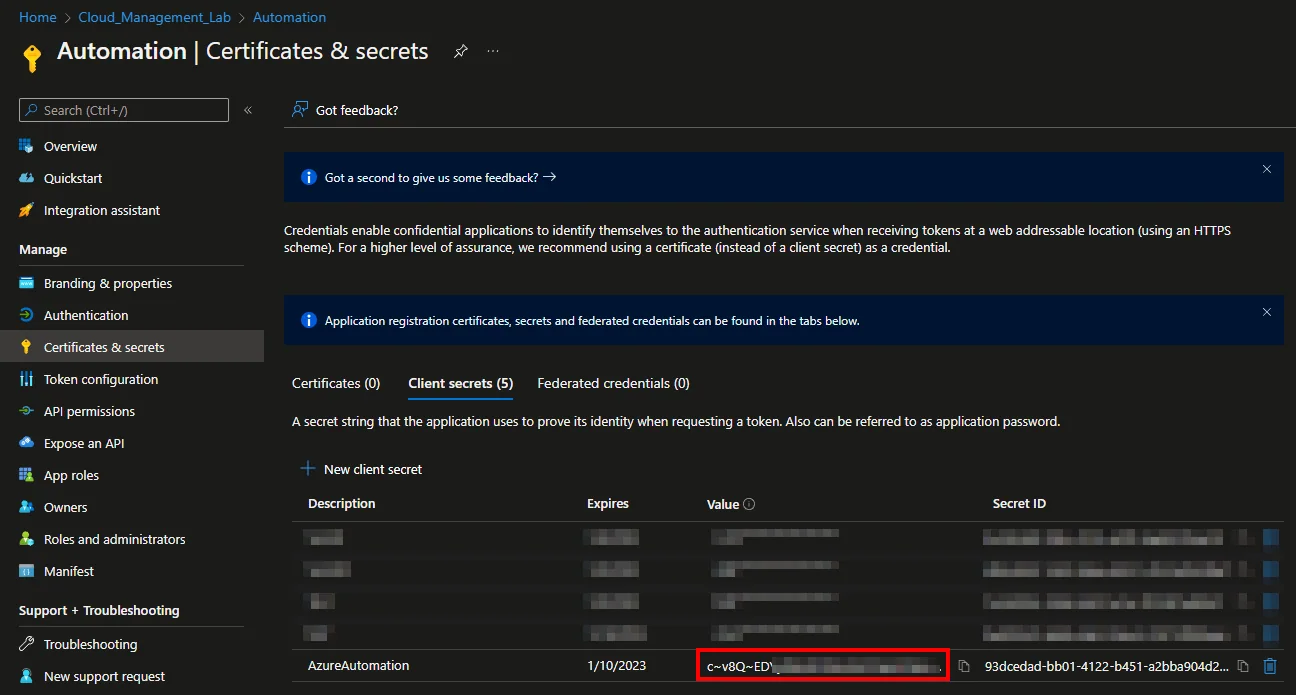
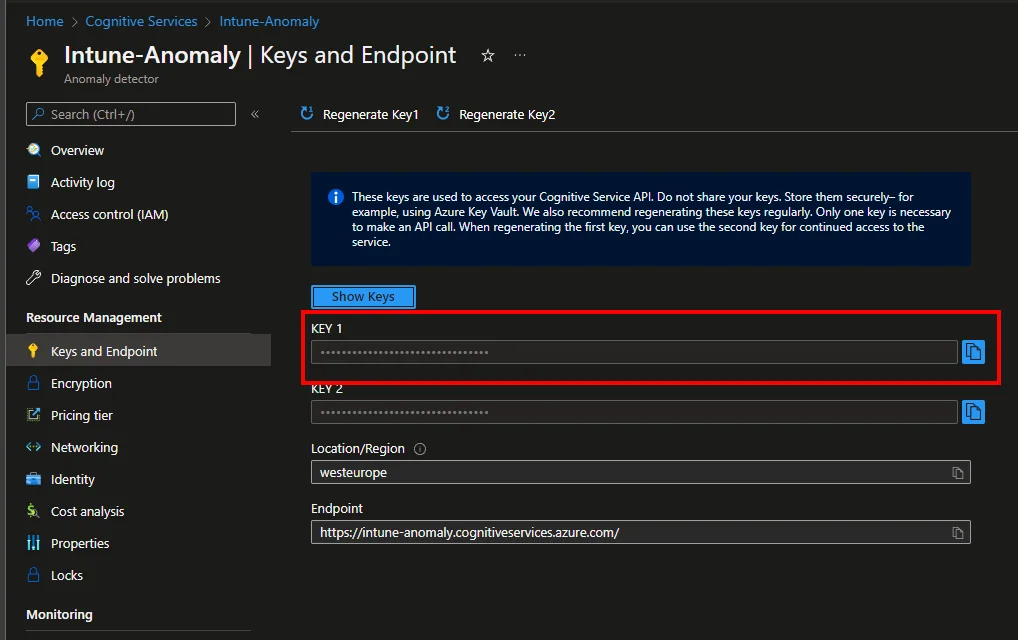
- Copy and save the Value and the Secret ID
Create Automation Account
- Search for Automation Accounts
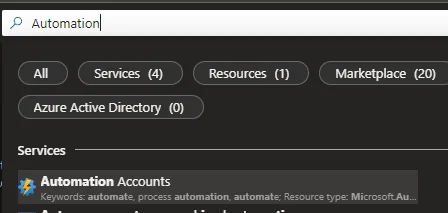
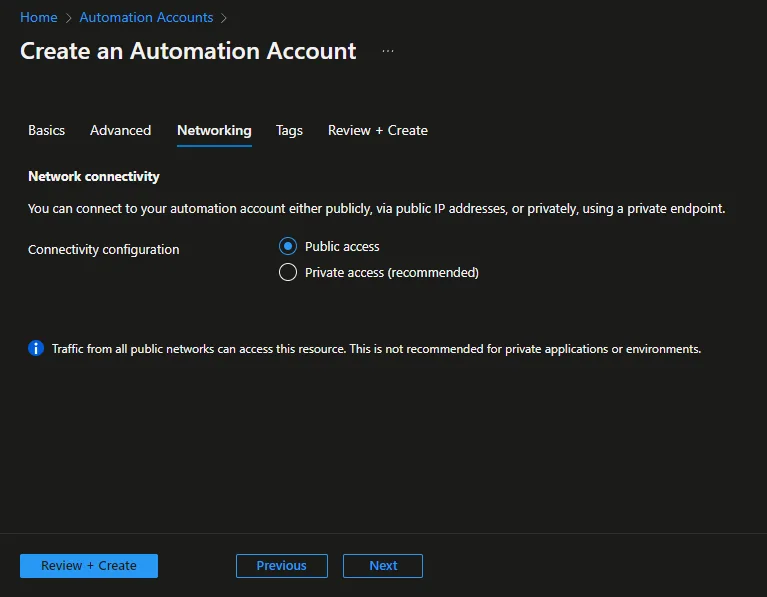
- Click + Create
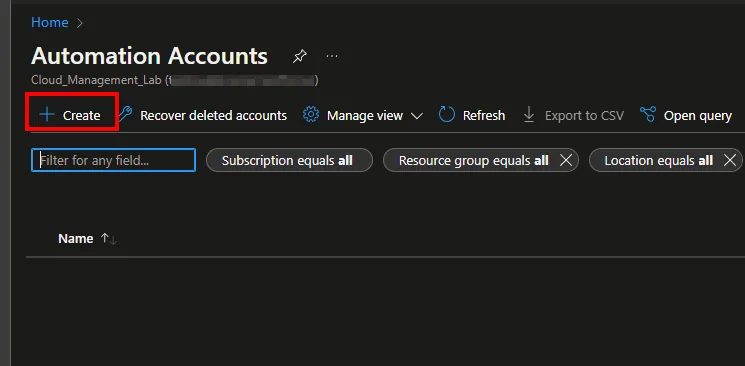
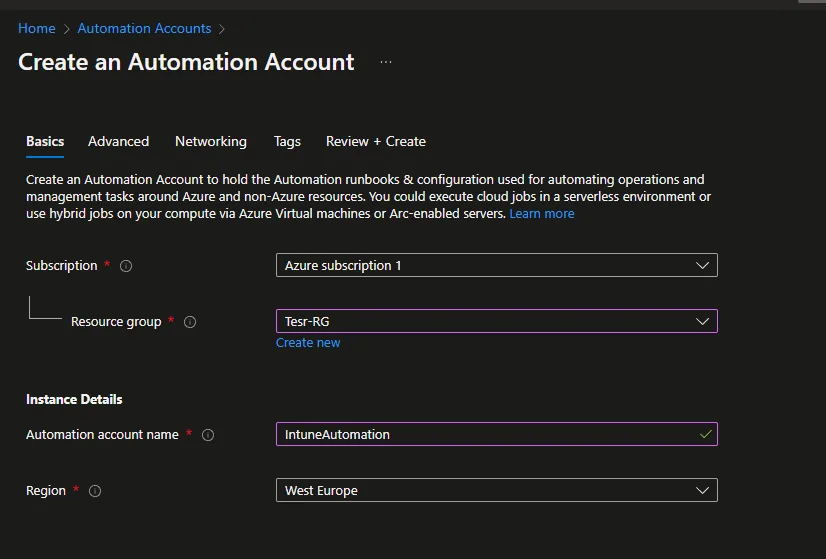
- Select a Subscription and a Resource group
- Enter an account name and select a Region
- Click Next
- Click Next
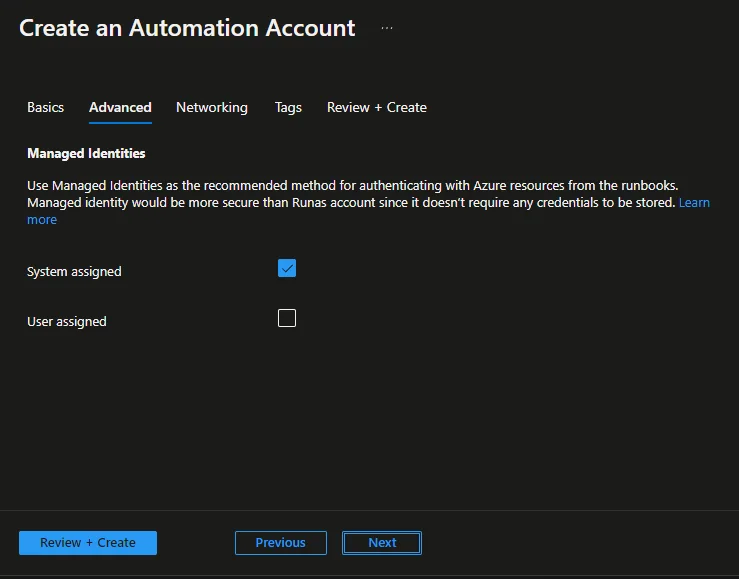
- Click Next -> Next -> Create
Create the Runbook
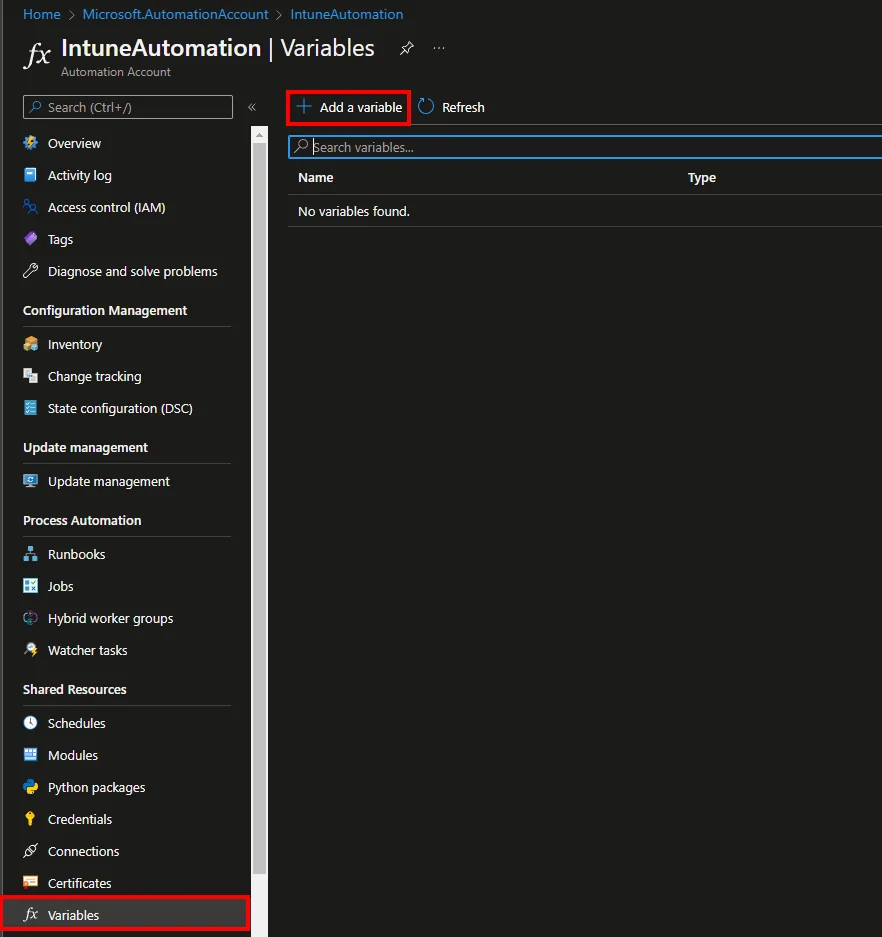
- Open the Automation Account
- Navigate to Variables and click + Add a variable
-
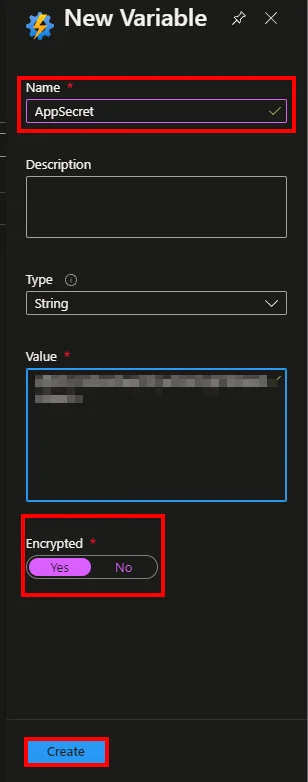
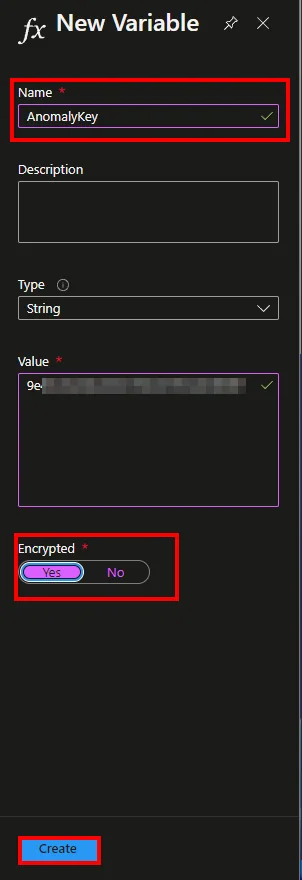
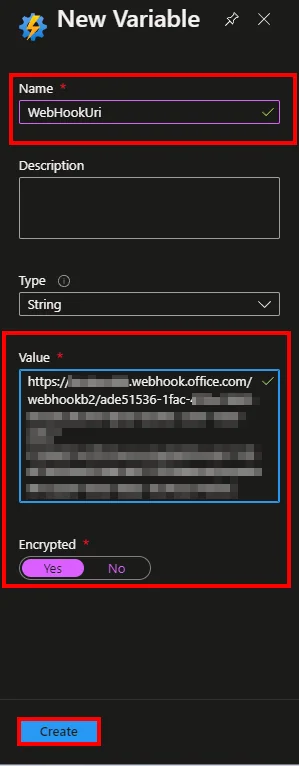
Add the Secret Value, TenantId, AnomalyKey, WebHookUri and the App ID as Variable
-
-
-
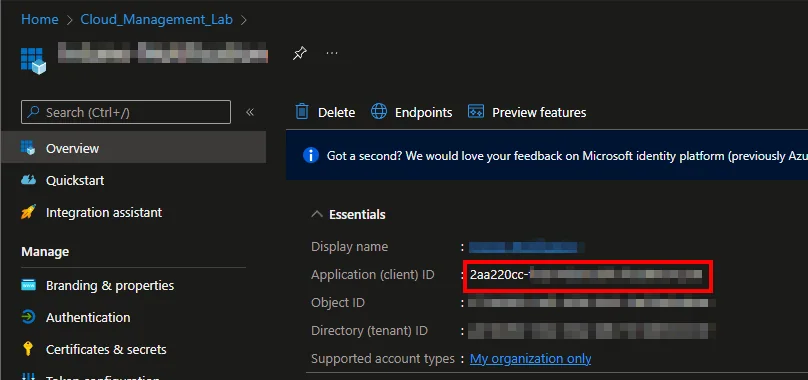
-
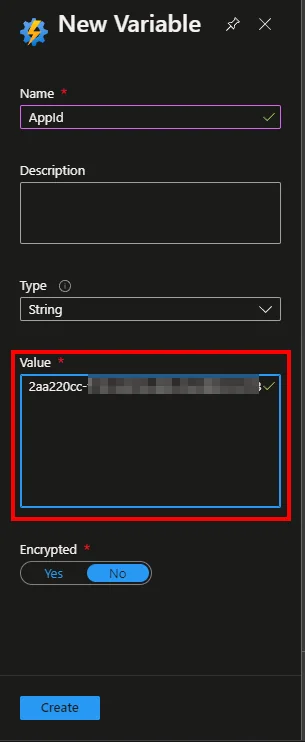
-
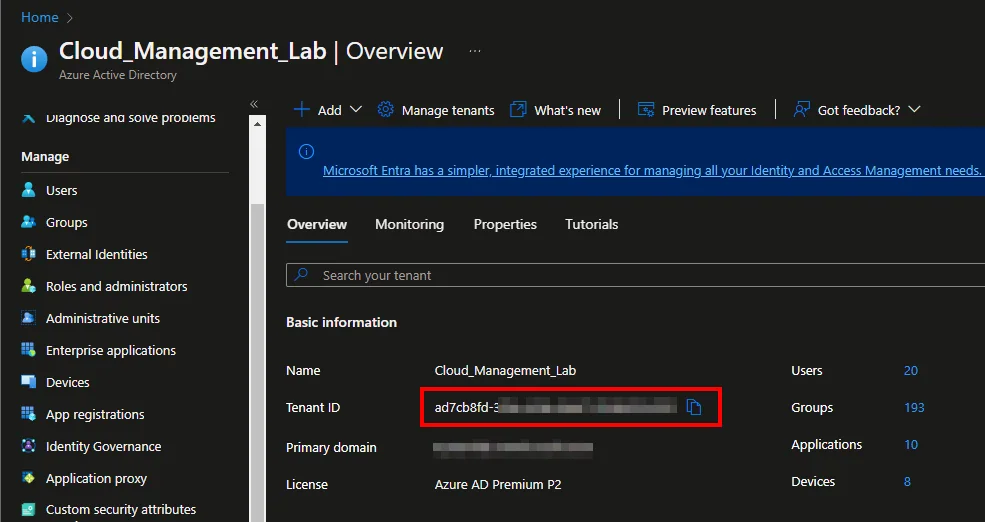
-
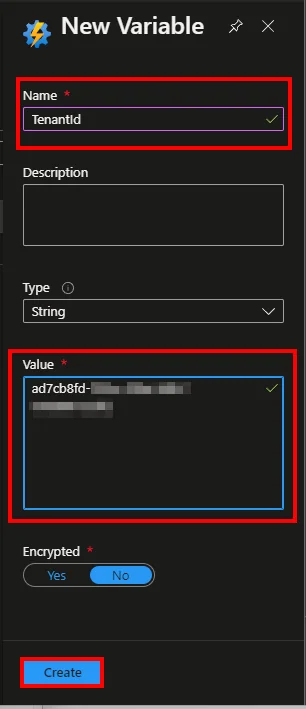
-
-
-
-
-
Select Runbooks
-
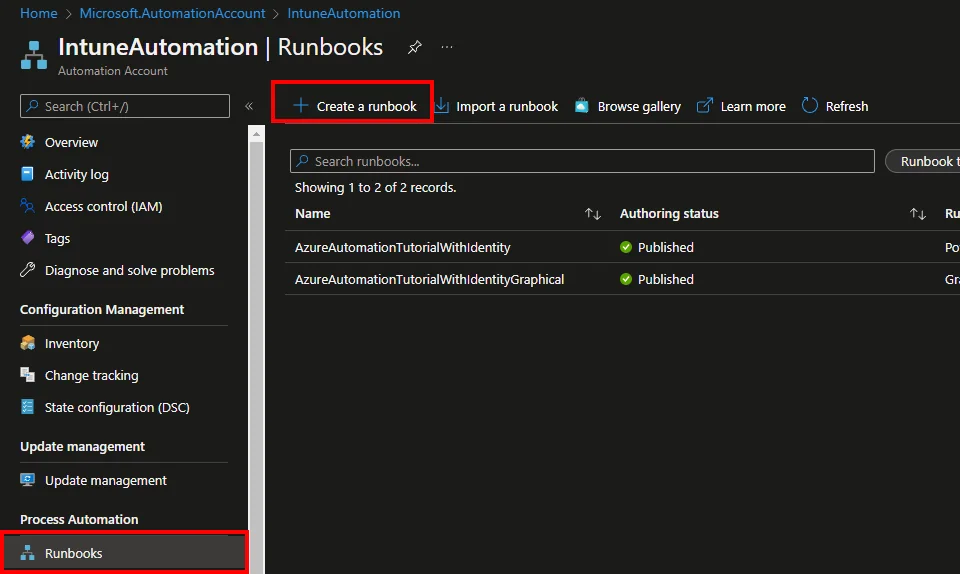
Click + Create a runbook
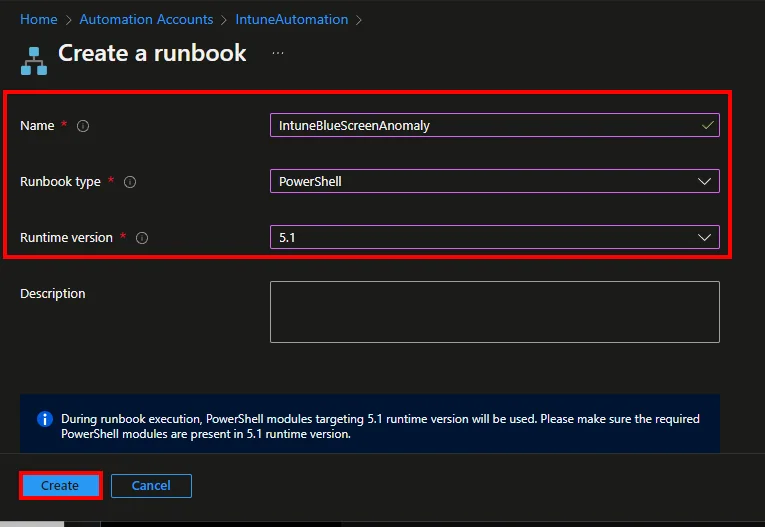
- Enter a Name
- Select PowerShell as Runbook type
- Select 5.1 as Runtime version
- Click Create
- Insert the Script from my Github repository
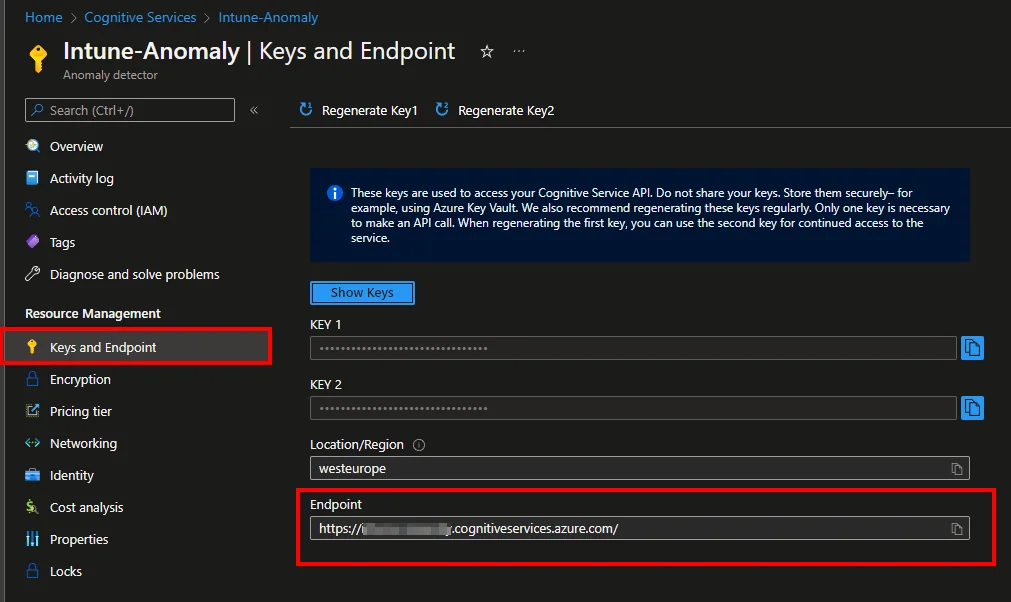
- Edit the variable $anomalyEndpoint (add here your endpoint from the Azure AI Services resource)

The BSOD time series uses the same two detection parameters. Their definitions are in the historical compliance walkthrough.
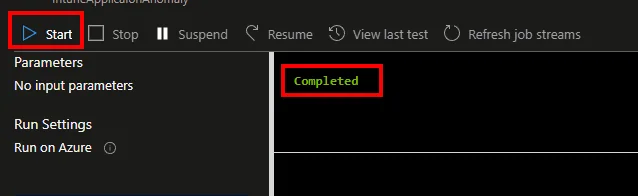
- Save and test the script

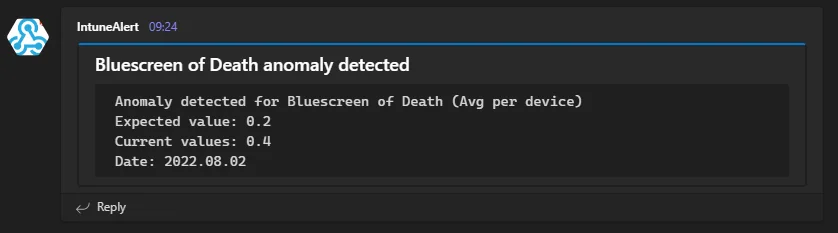
- Click Publish

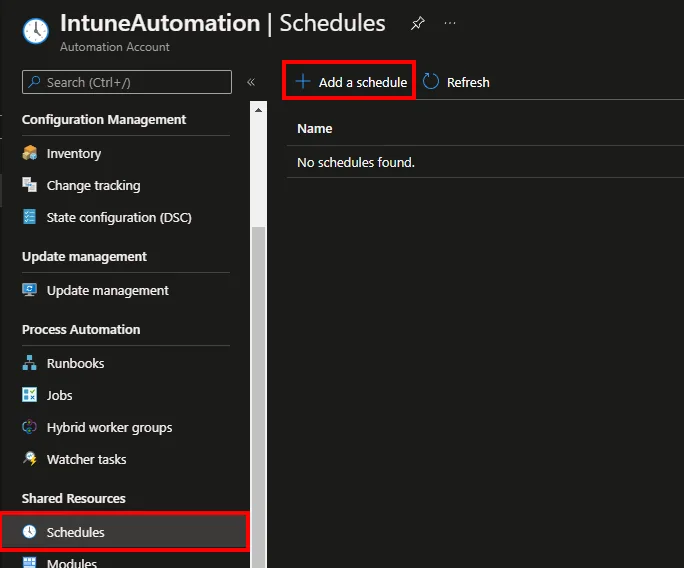
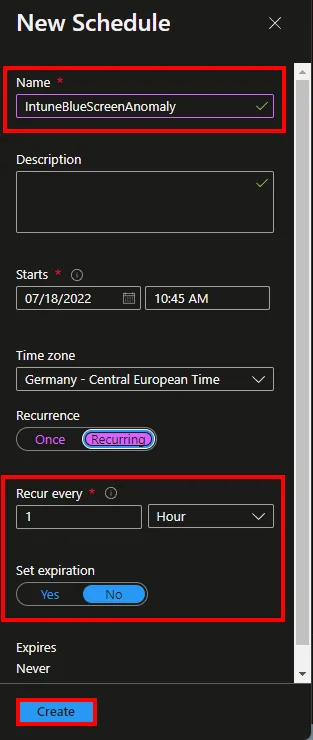
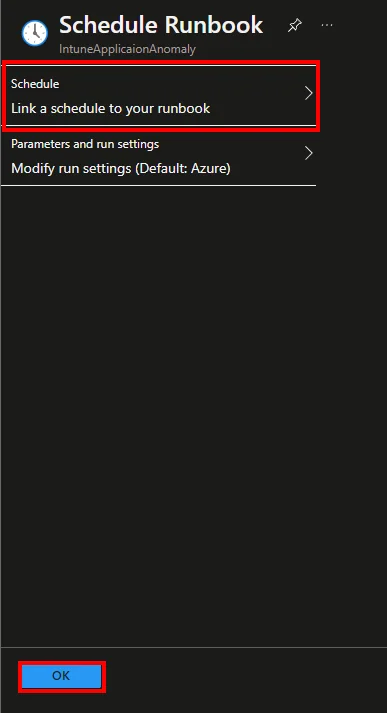
- Navigate to Schedules and click + Add a schedule
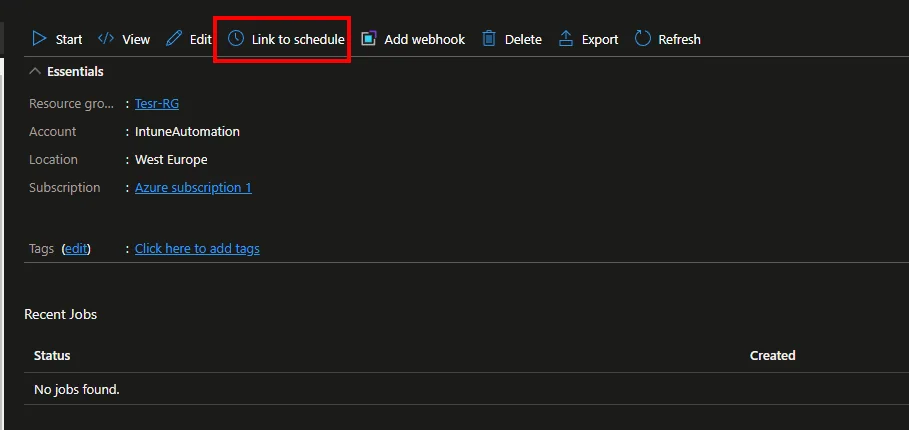
- Click Link to schedule and add the created schedule
Conclusion: why it pays to detect anomalies early
With an increased occurrence of Bluescreens of Death, it is important to be informed as early as possible so that you can react directly and identify the root cause, e.g. a faulty driver update, and stop or fix it right away. Because this solution uses machine learning to detect anomalies instead of static thresholds, it adapts to your fleet and keeps false alerts low. I hope this blog helped you build such a monitoring solution to detect anomalies in your Intune environment so you can be notified early and react in time.
Stay healthy, Cheers
Jannik