In the third part of this Intune Suite series, I want to give you more insights into advanced endpoint analytics. I am really happy that Intune has gone in the direction of machine learning and anomaly detection. I blogged about these topics a few months ago, discussing how to analyze Intune data with the help of cognitive service anomaly detection. It’s awesome that Intune now includes this out-of-the-box in the tool. Unfortunately, I can’t test this feature in my own tenant because Endpoint analytics requires at least 10 devices, and this is not possible in my test tenant. However, I will cover all elements of the feature in this blog.

Source: https://learn.microsoft.com/en-us/mem/analytics/anomaly-detection
What is Advanced Endpoint Analytics?
Advanced Endpoint Analytics part of the Intune suite and is an add-on feature integrated into Microsoft Intune. The advanced capabilities include anomaly detection, custom device scopes, and an enhanced device timeline, which offer granular insights, proactive detection of unreported issues, and improved troubleshooting capabilities.
Anomaly detection allows IT admins to proactively identify potential Windows device issues across their end-user computing landscape and troubleshoot them more effectively. Custom device scopes let customers analyse the performance and reliability of subsets of their devices, providing more granular insights for specific business groups or geographic regions. The enhanced device timeline assists with troubleshooting device issues by including more events and lower data latency.
Prerequisites
- You must onboard and enroll at least 10 devices to Endpoint Analytics.
- Add-On License for Advanced Endpoint Analytics (Coming soon) or Intune Suite license
- The advanced features in Endpoint Analytics are only available for Intune-managed (including co-managed) devices.
- Min Endpoint Analytics read RBAC permissions

How to open Endpoint Analytics
- Open the Intune Console
- Navigate to “Reports“
- Then, click on “Endpoint analytics” under the “Monitor” section

Which features are currently included in Advanced Analytics?
Anomaly detection in Endpoint Analytics serves as an early warning system that monitors the health of devices in your organization for user experience and productivity regressions after configuration changes. It helps identify issues affecting user experience before they escalate through other channels. The main focus of anomaly detection is on application hangs/crashes and stop error restarts.
Endpoint Analytics uses various statistical models for determining anomalies, including:
- Threshold-based heuristic model
- Paired t-tests model
- Population Z-score model
- Time Series Z-score model
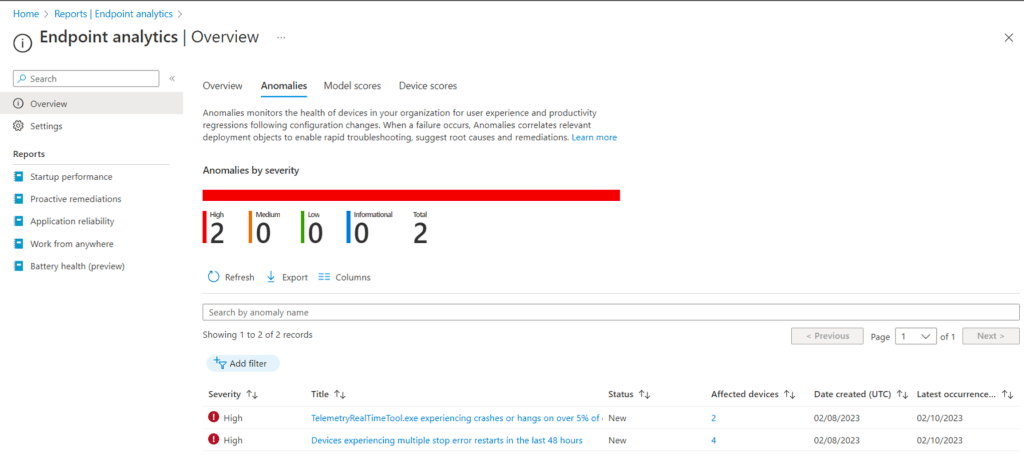
Source: https://learn.microsoft.com/en-us/mem/analytics/anomaly-detection
The enhanced device timeline in Endpoint Analytics allows you to see a history of events that have occurred on a specific device. You can filter the type of events that appear on the device timeline and select a time range of interest. The timeline contains app crash, app unresponsive, device boot, device logon, and anomaly detected events.
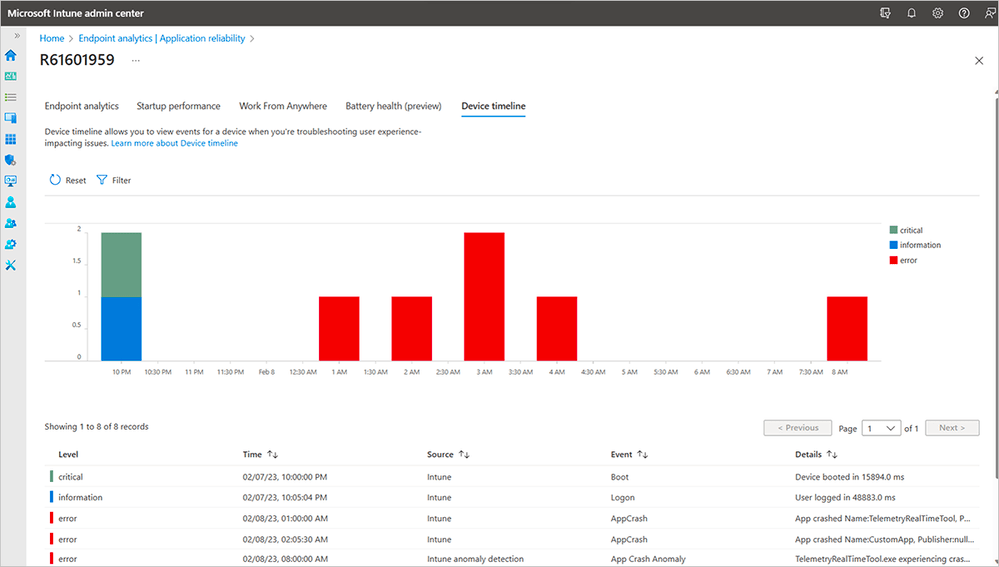
Custom device scopes in Endpoint Analytics use scope tags to slice reports to a subset of devices. This feature enables you to see scores, insights, and recommendations for a specific subset of your enrolled devices. Custom device scopes are supported on the following Endpoint Analytics reports:
- Startup performance
- Work from anywhere
- Application reliability
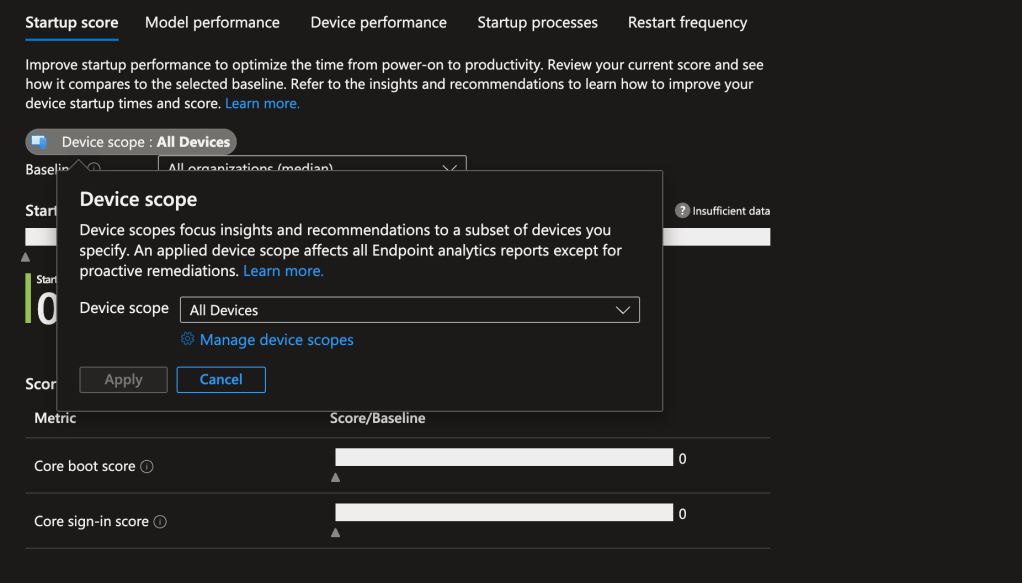
Limitations:
- Enhanced device timeline is only available for Intune-managed devices, and a device timeline is not available for Configuration Manager-only devices.
- You can save up to 100 custom device scopes, and up to 20 can be active at a time.
- Only one scope tag can be used to create a custom device scope.
How does the models work for anomaly detection
- Threshold-based heuristic model: This model involves setting one or more threshold values for application hangs/crashes or stop error restarts. Devices are flagged as anomalous if there’s a breach in the set threshold. This model is simple yet effective and is suitable for surfacing prominent or static issues with devices or their apps. Currently, the thresholds are pre-determined without an option to customize.
- Paired t-tests model: Paired t-tests are a mathematical method that compares pairs of observations in a dataset, looking for a statistically significant distance between their means. Tests are used on datasets that consist of observations related to each other in some way, such as the count of stop error restarts from the same device before and after a policy change, or app crashes on a device after an OS (operating systems) update.
- Population Z-score model: Population Z-score based statistical models involve calculating the standard deviation and mean of a dataset, and then using those values to determine which data points are anomalous. Standard deviation and mean are used to calculate the Z-score for each data point, which represents the number of standard deviations away from the mean. Data points that fall outside a certain range are considered anomalous. This model is well-suited for highlighting outlier devices or apps from the wider baseline but requires sufficiently large datasets to be accurate.
- Time Series Z-score model: Time series Z-score models are a variation of the standard Z-score model designed for detecting anomalies in time series data. Time series data is a sequence of data points collected at regular intervals over time, such as the aggregate of stop error restarts. Standard deviation and mean are calculated for a sliding window of time, using aggregated metrics. This method allows the model to be sensitive to temporal patterns in the data and adapt to changes in its distribution over time.
Graph Endpoints
In the context of advanced endpoint analytics, Graph Endpoints can be used to query data, such as anomalies, and create custom alerts based on the gathered information. This allows IT admins to be proactive and take necessary actions whenever an issue arises. Below are some examples of Graph Endpoints that you can use with advanced endpoint analytics anomaly detection:
Anomaly severity overview
https://graph.microsoft.com/beta/deviceManagement/userExperienceAnalyticsAnomalySeverityOverview
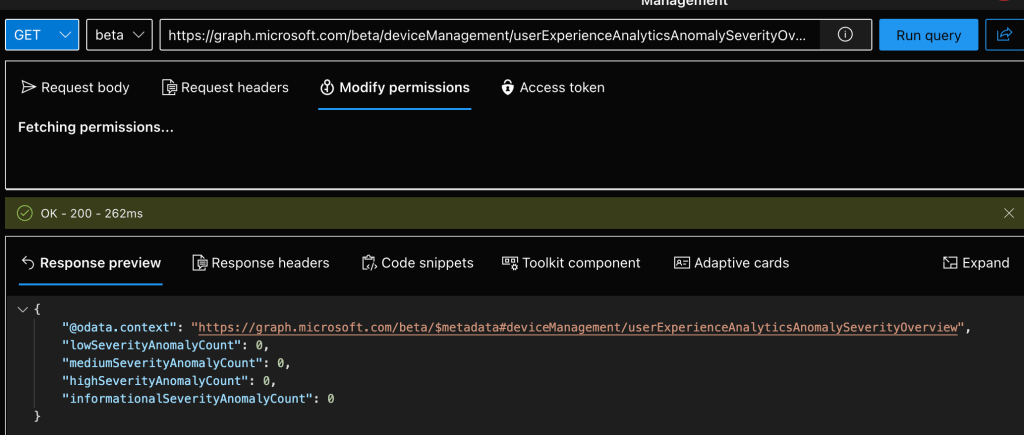
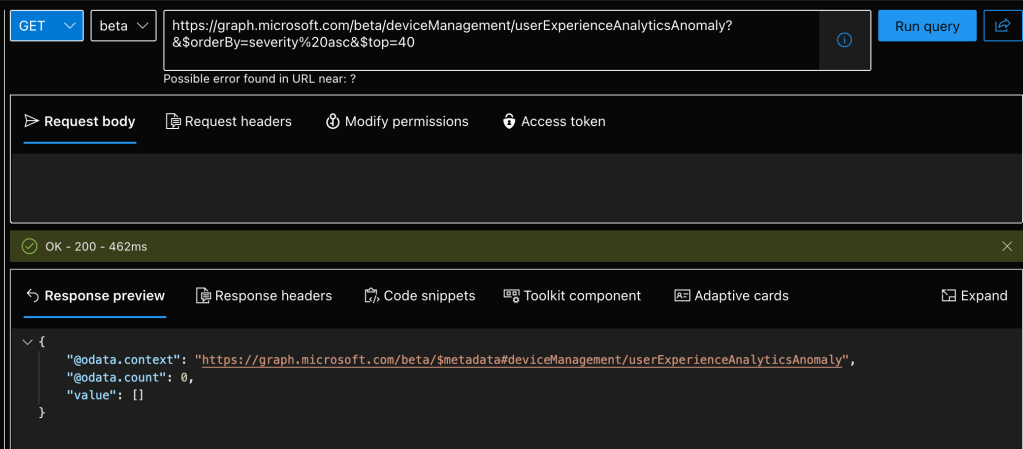
Anomalies
https://graph.microsoft.com/beta/deviceManagement/userExperienceAnalyticsAnomaly?&$orderBy=severity%20asc&$top=40
Further Informations
- https://techcommunity.microsoft.com/t5/microsoft-intune-blog/introducing-advanced-endpoint-analytics-with-microsoft-intune/ba-p/3755507
- https://learn.microsoft.com/en-us/mem/analytics/enhanced-device-timeline
- https://learn.microsoft.com/en-us/mem/analytics/anomaly-detection
- https://learn.microsoft.com/en-us/mem/analytics/device-scopes
- https://learn.microsoft.com/en-us/mem/analytics/advanced-endpoint-analytics

[…] https://jannikreinhard.com/2023/04/02/intune-suite-part-3-advanced-endpoint-analytics/ […]
LikeLike