

Users always complain that the network is slow. This can also be measured centrally using various network monitoring tools. However, this monitoring can only provide complete insight if the user is actually onsite in the corporate network. If the user is sitting in the home office and is connected to the internet via his own router, this is not always so easy. But there are also many other reasons why a user has a slow connection. It is not always due to the network. In this block I want to show you how you can test the speed of all clients regularly with a simple remediation script and upload it to a log analytics workspace to do some analysis.

How does it work
The whole thing works very simple on my Github repository is a 5MB file that consists only of “aaaaaaaa” characters.

The script is downloaded this file several times and the time is measured.

From this time an average is calculated and uploaded together with the local IPs and the public IP into the log analytics workspace.

Create an Log Analytics Workspace
- Open the Azure Portal
- Search for Log Analytics workspace

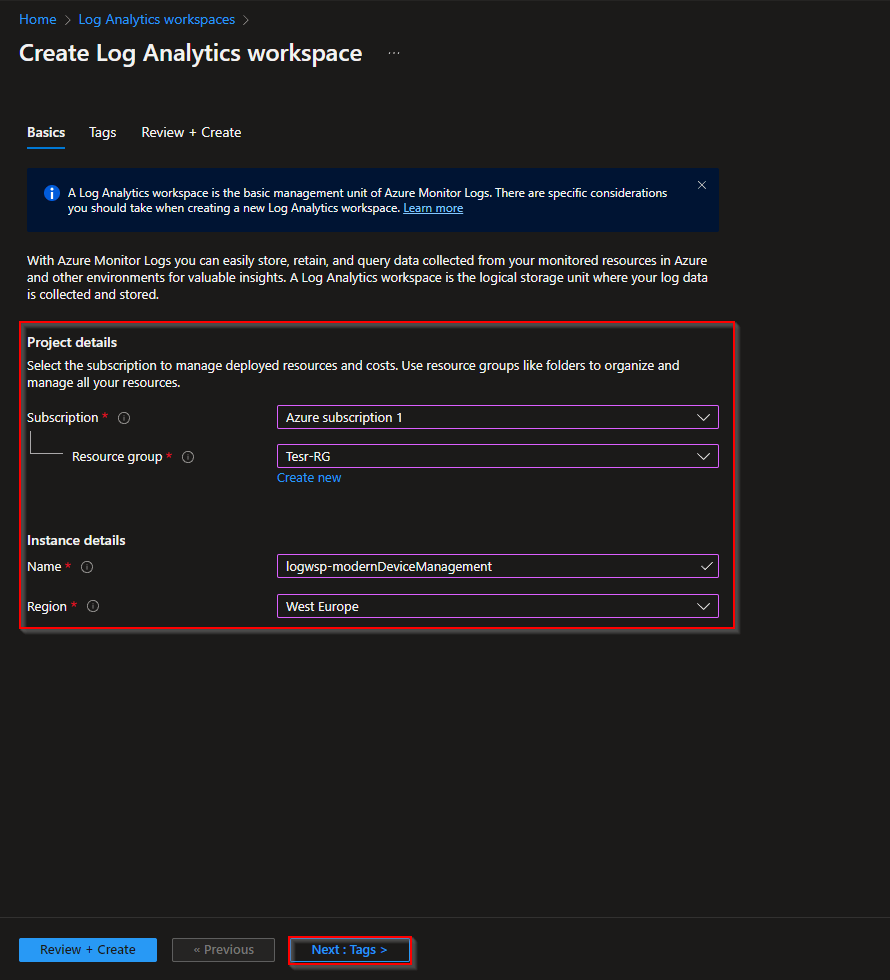
- Select the Subscription and the Ressource group or create a new one
- Enter a name for the workspace
- Select the region
- Click Next: Tags >
- Optional: Add Tags
- Click Next: Review + Create >

- Click Create

Get Workspace information’s
- Open the new Log Analytics Workspace
- Navigate to Agent management
- Here you can find the Workspace ID and the Primary key. You need this information later to insert this in the script

How to collect the data
- As with many of my blogs, it starts with a script on my Git hub repository. So download this script first.
- Insert the Workspace ID and the log analytics primary key. Optional you can also make the seedtest with an other file on your own blob storage.

- To deploy this toast menu to the clients, we open the MEM portal and navigate to Reports -> Endpoint analytics -> Proactive remediations
- Click Create script package

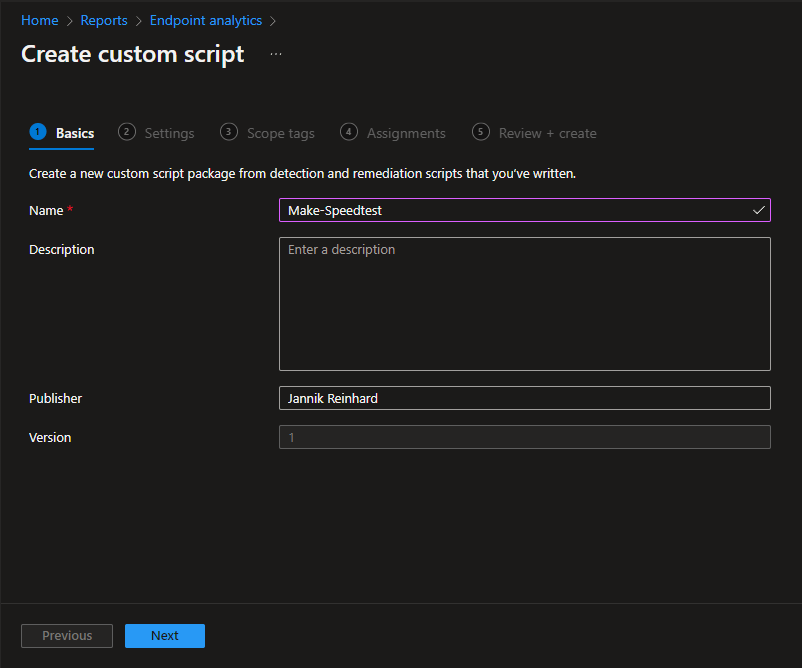
- Enter a name
- Click Next
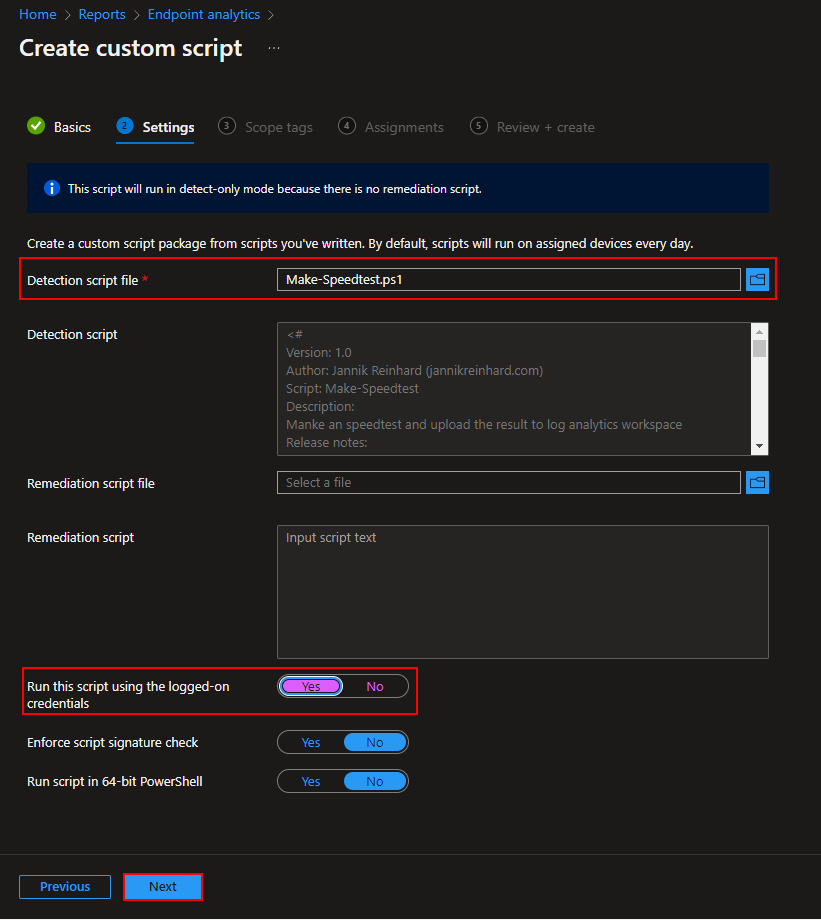
- Upload the script as detection script and the remediation script
- Select Yes for Run this script using the logged on credentials
- Click Next
- Click Next
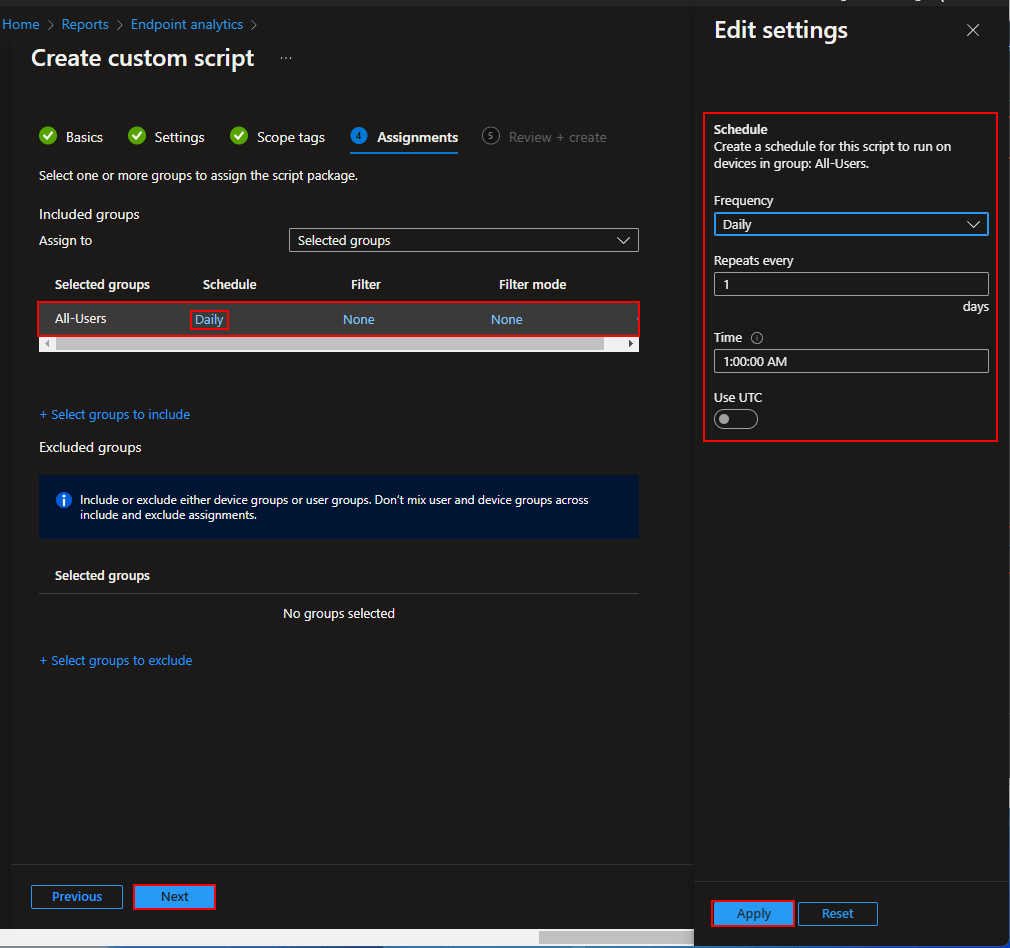
- Assign the Script to a group and click on Daily
- In my case I select a Daily schedule (You can also select a other schedule) and click apply
- Click Next
- Click Create
Check if everything works
- Open the Log analytics workspace here you should have a logfile with the name Speedtest_CL.
- If you see some entries of your clients in the workspace then everything works.
This is a very simple method to get an overview of the speed by downloading a simple file from the Internet. Of course the script can be extended to download larger files or files from different regions. You can also do a lot with the data. Through KQL and Workbooks you can create dashboards or e.g. display an average over time via public IP or local subnet. You can also send alerts if you see a strong negative trend in a site. The possibilities here are great.
Stay healthy, Cheers
Jannik
