

As you know I like everything what is related to data science and Intune. In this blog I will show you a solution how you can get some insights about your Intune environment you did not have bevor.
Content
- Content
- Prerequisites
- How the solution work
- What is sweetviz
- How to run the solution
- How does it looks like
Prerequisites
The prerequisites to use the solutions are really low. The only thing what you need is python installed on your device. You can install python from this link. In addition to this you have to make sure that sweetviz is installed on your device. You can to this with the following command:
pip install sweetviz
How the solution work
It is really simpel. The first step is to download data from graph like all managed devices. Then this json will be converted into an pandas dataframe and than the sweetviz will be called.
What is sweetviz
Sweetviz is an open-source Python library used for performing data analysis. It’s designed to help data scientists understand the structure of a dataset, detect relationships between variables, and identify potential issues like missing values or inconsistent data types.
One of the key features of Sweetviz is its ability to generate attractive and detailed visualizations in the form of interactive HTML reports. These reports can provide insights into the distribution of individual variables, comparisons between different subsets of data (such as training vs. test datasets), and much more.
With Sweetviz, you can:
- Create detailed visualizations of data distributions and interactions.
- Compare datasets, such as training vs. test data.
- Analyze the distribution of target variables in classification or regression tasks.
- Assess the balance of classes in classification tasks.
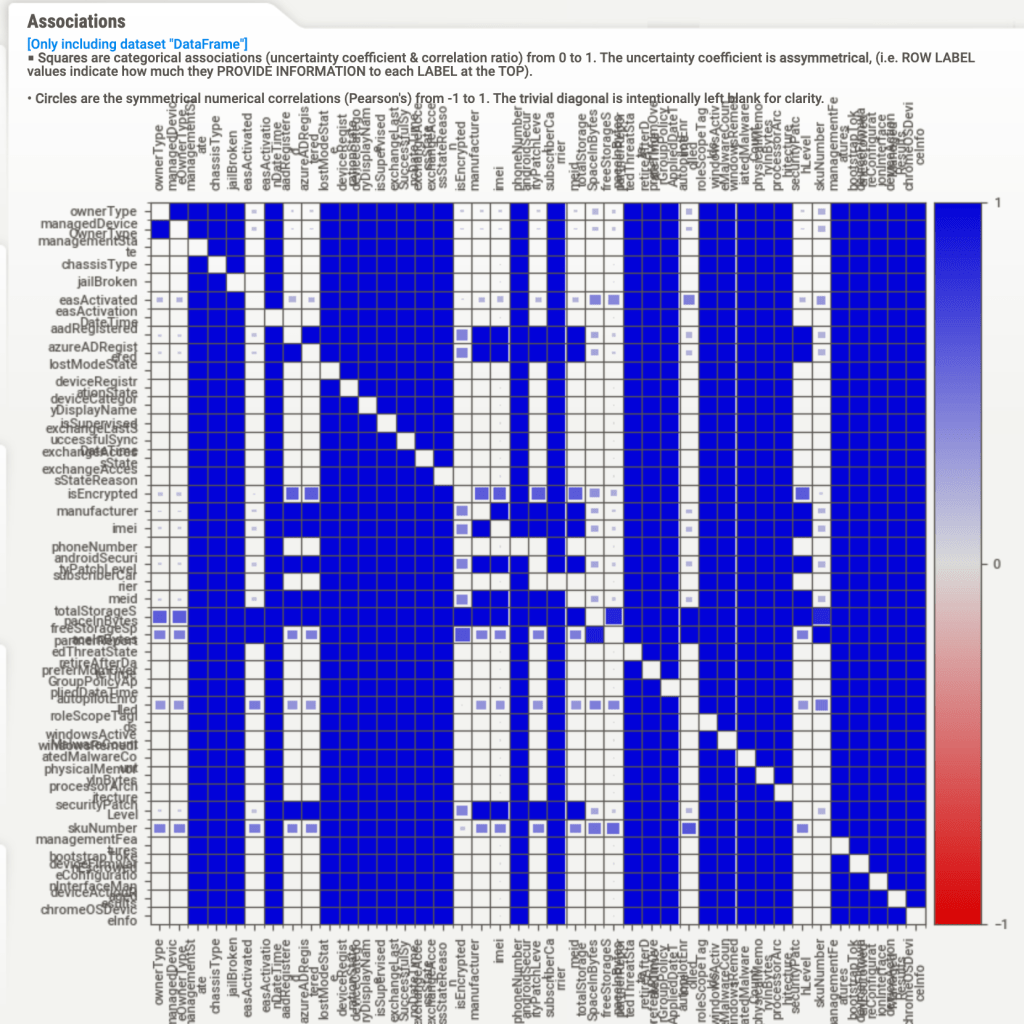
- Identify and visualize feature associations and correlations.
- Detect and report missing values, duplicate entries, or outlier data.
Sweetviz is often used in the early stages of a data science project to perform quick and efficient EDA, which can help guide subsequent data cleaning, feature engineering, and modeling decisions. It’s praised for its ease of use and the comprehensiveness of the reports it generates.
How to run the solution
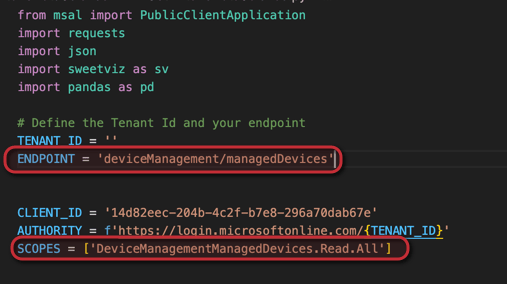
You can download the script from my github repository. The only thing what you have to do is to fill out the TENANT_ID variable and to run this script. This script will then generate a HTML page with an overview of your devices / users or some there graph calls you specify.
For more advanced calls or use cases you have to extract values from jsons or lists. You can do this like this:df['serialNumber'] = df['hardwareInformation'].apply(lambda x: x.get('serialNumber') if isinstance(x, dict) else None).astype(str)
You can also change the graph endpoint when you change it here:
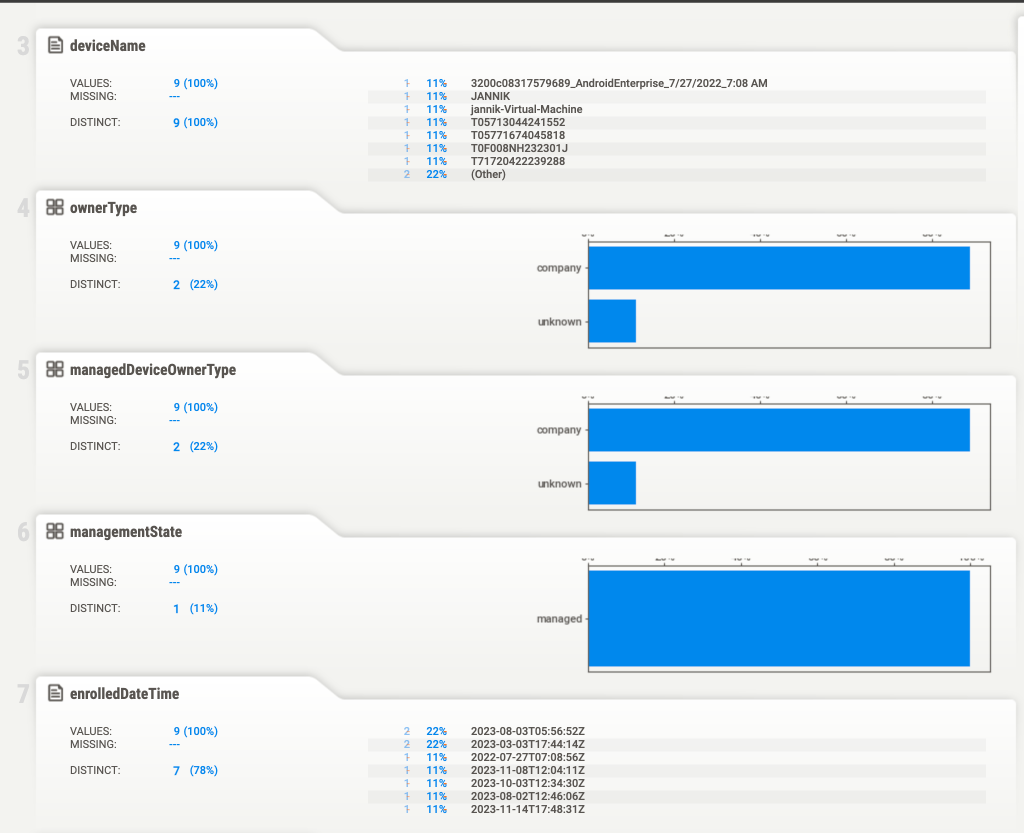
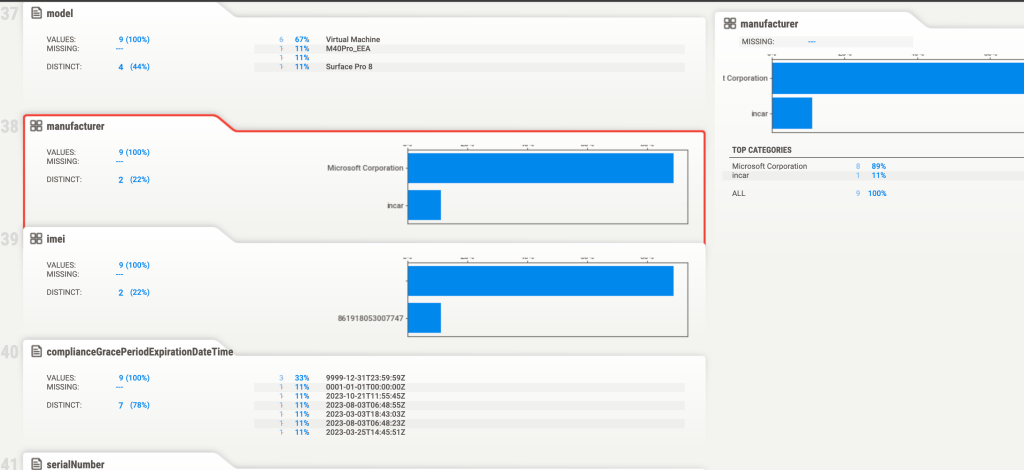
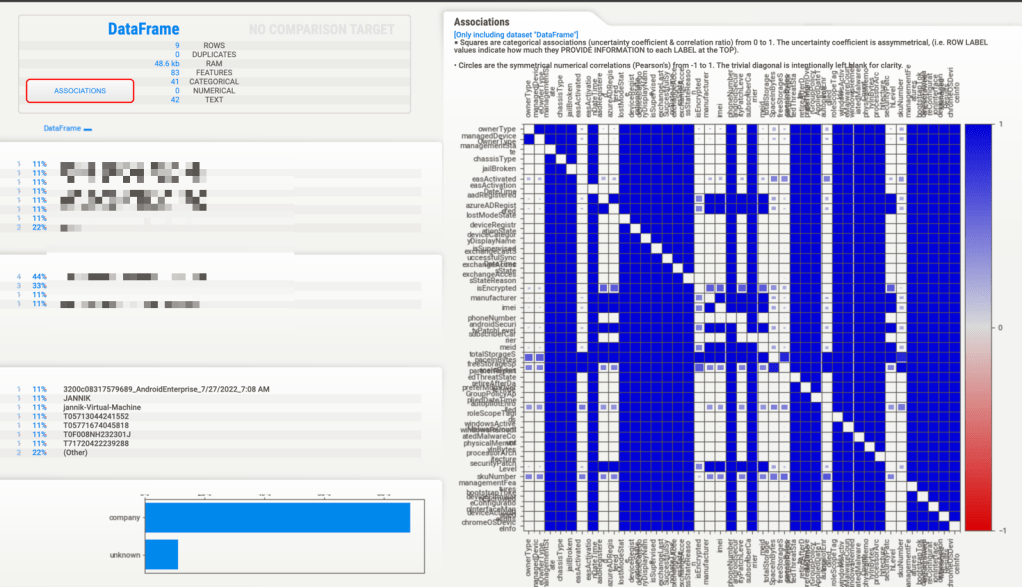
How does it looks like
Here you can find an overview how the output looks like:

[…] The easy way to make data science with Intune […]
LikeLike